There’s a reason Labor Day is called the unofficial end of summer. It’s still very much actually summer and it will feel like it. Here’s what else you can expect from mother nature this week.
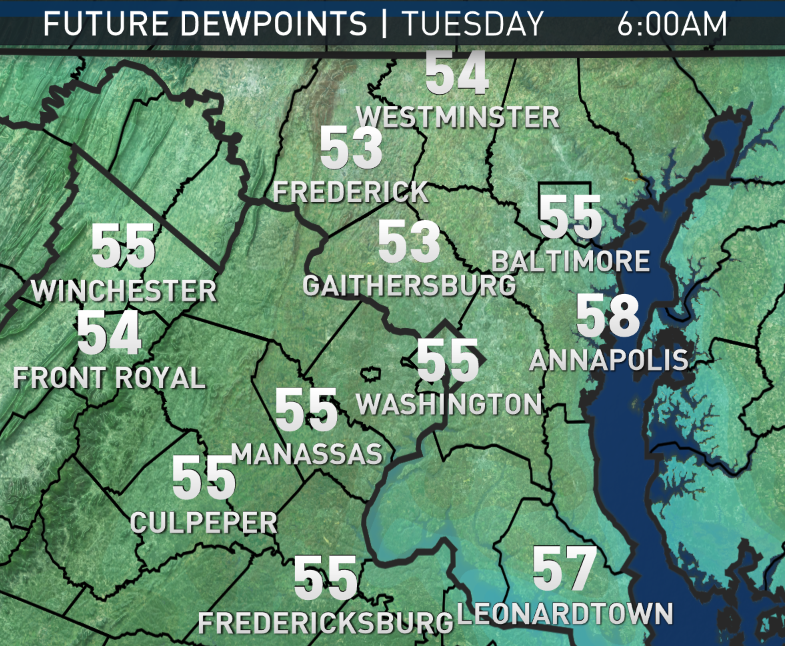
The following two maps show the changes in the humidity and comfort level, as the new pattern establishes itself Tuesday into Wednesday according to the RPM computer model. This map for Tuesday is set for heading back to work in the morning.
(Data: The Weather Company. Graphic: StormTeam 4/WTOP)
Data: The Weather Company. Graphic: StormTeam 4/WTOP
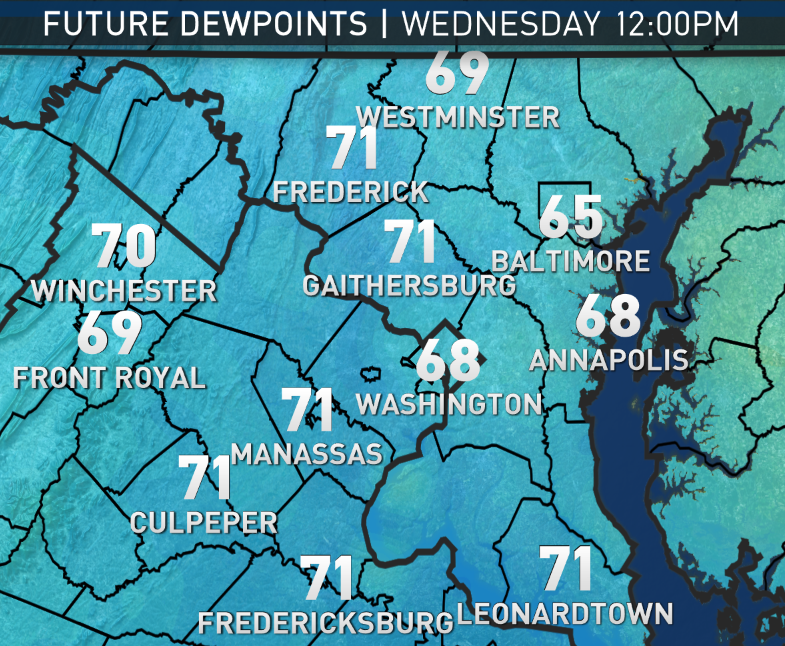
This map for Wednesday is for the afternoon, when it will start to feel oppressively humid by September standards. Remember, the higher the dewpoint, the higher the moisture content in the air. Dewpoints in the 50s generally feel nice and comfortable, but when they’re in the upper 60s and lower 70s it feels sultry.
(Data: The Weather Company. Graphic: StormTeam 4/WTOP)
Data: The Weather Company. Graphic: StormTeam 4/WTOP
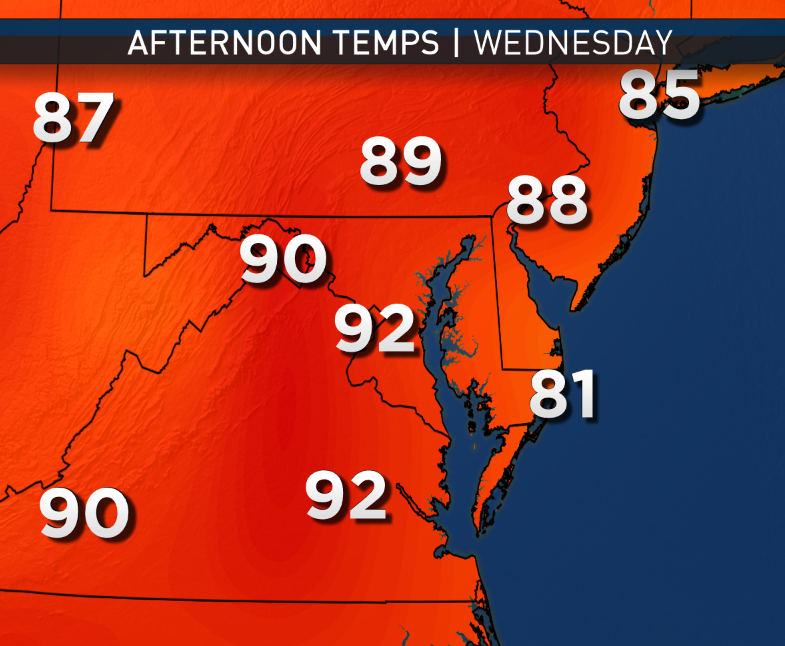
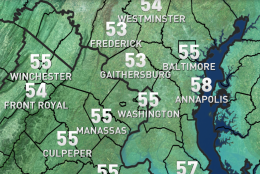
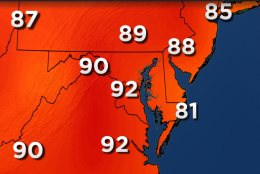
This map shows the GFS computer model output for afternoon temperatures the second half of the workweek.
(Data: Environmental Modeling Center/NOAA. Graphic: StormTeam 4/WTOP)
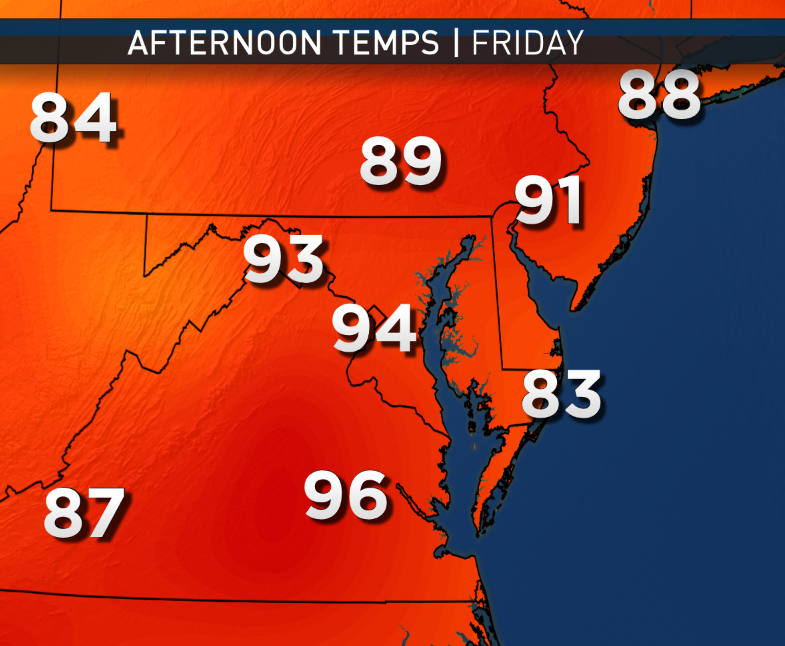
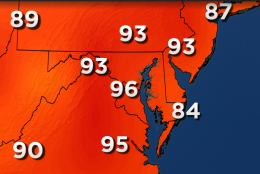
This map shows the GFS computer model output for afternoon temperatures the second half of the workweek.
(Data: Environmental Modeling Center/NOAA. Graphic: StormTeam 4/WTOP)
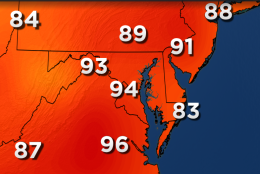
This map shows the GFS computer model output for afternoon temperatures the second half of the workweek.
(Data: Environmental Modeling Center/NOAA. Graphic: StormTeam 4/WTOP)
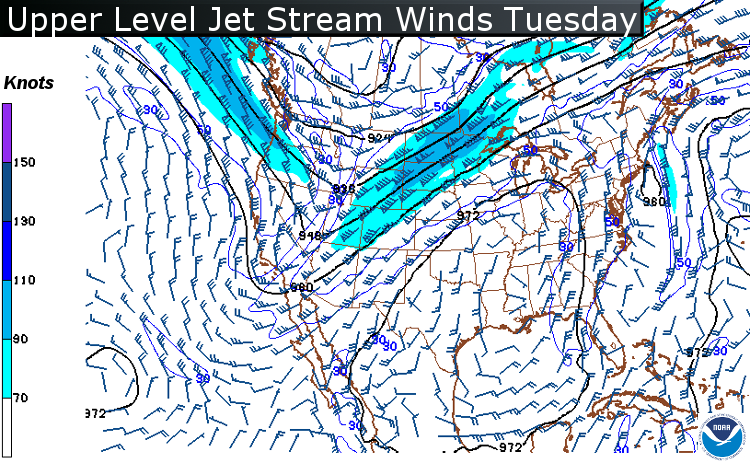
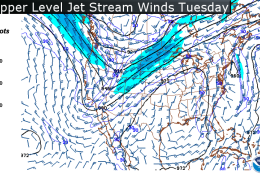
This map is also from the GFS computer model for the upper level winds. Where the winds are concentrated with the strongest speeds is the Jet Stream. It shows the ridge of high pressure building here along the East Coast, forming the Bermuda High pattern. Where there’s a trough or a dip in the Rockies, it will be cooler than average. That trough may also help draw some tropical rains into the desert southwest from a Pacific system. The tail on the wind barbs, as they’re called, are showing the direction from which the wind is blowing. The strong jet speeds are a consequence of the contrast in temperatures between Canada and the eastern United States. It could contribute to some big thunderstorms in the Midwest as a slow moving cold front moves across the area.
(Data and Graphic: Environmental Modeling Center/NOAA.)
Data and Graphic: Environmental Modeling Center/NOAA.
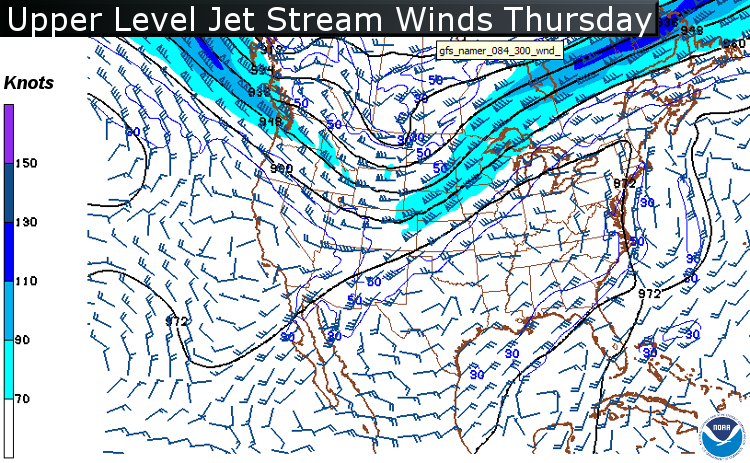
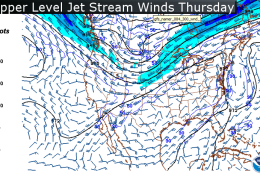
This map is also from the GFS computer model for the upper level winds. Where the winds are concentrated with the strongest speeds is the Jet Stream. It shows the ridge of high pressure building here along the East Coast, forming the Bermuda High pattern. Where there’s a trough or a dip in the Rockies, it will be cooler than average. That trough may also help draw some tropical rains into the desert southwest from a Pacific system. The tail on the wind barbs, as they’re called, are showing the direction from which the wind is blowing. The strong jet speeds are a consequence of the contrast in temperatures between Canada and the eastern United States. It could contribute to some big thunderstorms in the Midwest, as a slow moving cold front moves across the area.
(Data and Graphic: Environmental Modeling Center/NOAA)
Data and Graphic: Environmental Modeling Center/NOAA
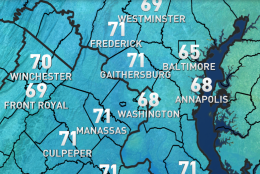
Labor Day will be seasonable and comfortably warm, a great day for outdoor activities, but things are expected to heat up later in the week.
(Graphics: StormTeam 4/WTOP)
WASHINGTON —Many people have Monday, Labor Day, off from work. But for those who don’t, we’ll still include it in this edition of the Workweek Weather blog.
Nature doesn’t always adhere to the calendar, anyway. But this week nature will adhere and it will be a reminder that Labor Day only marks the unofficial end of summer. It’s still very much actually summer, and it will feel like it.
The high-pressure system — which ultimately wasn’t positioned ideally enough to send Hermine back closer to the coast over the weekend, sparing beach-goers additional heavy rains (but not the heavy surf and some beach erosion)— will have already wedged its way down from New England and the Appalachians, bringing a cool, dry, comfortable start to Monday. The storm will still be off the Mid-Atlantic coast, sending, perhaps, some additional high-level clouds overhead. But that will be the end of its effects for us.
Labor Day will be seasonable and comfortably warm, a great day for outdoor activities. But the ridge of high pressure will settle to our south and east Tuesday, while what’s left of Hermine heads up the New England coast. The new position of the high will work like another Bermuda High, bringing us another heatwave, a significant one for this late in the season.
The pattern will be aided by a strong trough of low pressure (a “dip” in the jet stream) out west in the Rockies and northern Plains, associated with some early cooler weather spilling into central Canada. All that combined with the winds sloping down the Appalachians (compressing the air) will mean temperatures well above average this week and close to records. Eventually a bit of humidity will be tapped from the Gulf of Mexico, making it feel even hotter.
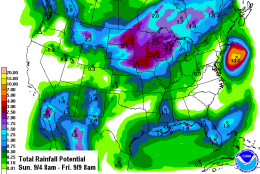
A cold front will be inching its way across the country during the week, but it won’t get here until the weekend at the earliest, and that will be the next chance for any precipitation. When fronts are essentially parallel with the jet stream, they move very slowly.
Daily weather highlights
Monday/Labor Day
Sunshine through high level clouds
Afternoon temperatures a little above average in the mid 80s
Tuesday:
Winds at the surface starting shifting a bit more southwesterly
Very comfortable start to the day
Lots of sunshine and westerly flow help temperatures rise to near 90 or low 90s
Humidity creeps back up to the stickier levels during the evening
Wednesday and Thursday:
Very hot for early September
Humidity gets back up into the muggy range, making it feel even hotter
Still rain-free with only partial cloudiness
Friday
More cloud cover may keep temperatures in lower 90s, but heat wave continues