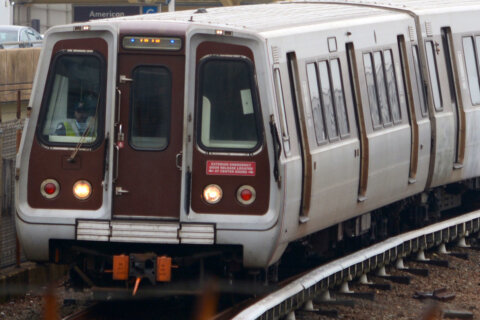
Metrobuses are crashing into people, cars and other things more often, adding to issues already facing the system. New data also show Metrobuses have been breaking down more frequently than in recent years.
Metrobuses had 67 collisions per million miles driven between July and December, more than three times Metro’s goal, a new Metro performance report said. That is an increase from about 60 collisions per million miles driven over the preceding two years, with the largest increase in preventable collisions the driver could have avoided.
In just October, November and December, there were 433 collisions where Metro’s drivers were not at fault, a 2 percent increase from the previous year. There were 355 preventable collisions, a 26 percent increase from the previous year.
More than half of the collisions saw a bus hit a parked car; hit a stationary object such as a light pole; or sideswipe another vehicle.
Metro plans to ask local governments for intersection improvements and to review video of crashes to “allow coaching of operators to maintain proper spacing and other safe operations.”
Over the whole six-month period from July through December, drivers hit 14 people walking or biking who had to be taken to the hospital, double the number at the same point in the previous year.
Bus rider injury rates are up about 9 percent to 3.07 per million trips. Like car drivers and passengers, collisions are the most common cause of injuries.
Rail rider injury rates ticked up 10 percent, but remained much lower at 1.37 per million trips.
The MetroAccess rider injury rate dropped to 1.86 per 100,000 riders.
Combined, the overall Metro customer injury rate has risen from 1.92 per million trips in the 2017 budget year to 2.02 in the 2018 budget year that ended last June, to 2.18 in the six months since July 1.
Metro employee injury rates declined from a spike last year.
Rail worker injuries fell to 3.5 per 200,000 hours worked. Bus worker injury rates dropped to 9.4 per 200,000 hours worked but remained above targets. Collisions, falls, lifting or pushing, and assault or stress were among the most common worker injuries.
Bus breakdowns rise
The buses are also breaking down more frequently, “traveling an average of 6,322 miles between service interruptions through the first six months of FY2019 — a 16 percent decline compared to the same period last year, due to a range of minor defects that are currently being addressed,” a separate quarterly financial report said.
It is a 22 percent decline in reliability comparing October, November and December to the same period a year earlier, even with some improvements in December. It continues a drop since December 2017.
Key problems are with Metro’s hybrid buses that are used for more than 60 percent of the system’s service.
Metro requested an outside peer review of its bus maintenance that was done in January, and the agency is now looking at ways to implement recommendations to improve bus purchasing, fleet management, contract management and “human capital.” The agency is looking into electric buses.
The direct impact of the current reliability issues on riders is somewhat unclear since bus on-time performance numbers are too unreliable to be counted on. Metro blames faulty software on board about 10 percent of buses and other errors in bus-tracking technology. Metro plans fixes for both issues by May.
Rail breakdowns fall
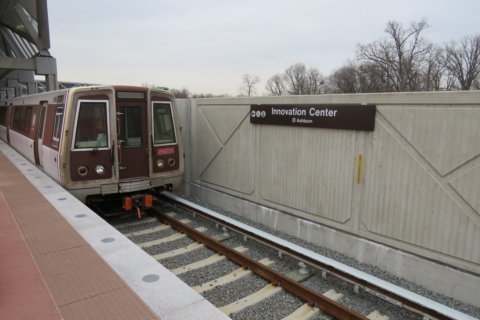
Rail car breakdowns have declined significantly with many more new trains accepted for service.
The 7000 Series trains averaged 220,785 miles between problems that caused significant delays between July and December, more than twice the distance managed by Metro’s 3000 and 6000 Series cars.
Metro also reported less serious crime in the six month period than the same time last year.
The Part I crime rate dropped 14 percent to 3.7 crimes per million trips across the rail and bus system.
There were also fewer red signal violations, fires and vehicle derailments.

