WASHINGTON — Metro ridership continues to fall, mainly due to far fewer trips on the bus system where fare hikes were most significant this summer, even as Metro says more riders are on time.
Metro: More trains running on time
In part due to the way Metro calculates riders’ on-time scores — accounting for the scheduled gap between trains — on-time performance jumped from 79 percent in June to 86 percent in July. It has since remained flat or shown signs of a slight trailing off.
Metro credits the retirement of old rail cars, the reduction in 24/7 work zones and the reduced rush-hour schedule for the overall increase to 87 percent of rail trips being scored as on time in the last six months of 2017.
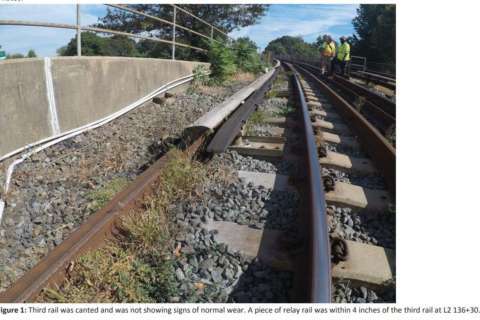
While the number of speed restrictions resulting from track inspections are down 40 percent, Metro said, a 35 mph speed restriction on 23 miles of track downtown that was implemented in August remains as part of a study on power usage. Combined, Metro said an average of around 8 percent of its tracks are under some type of slowdown, even if the restrictions do not always have significant impacts on riders.
Metro regularly single-tracks for critical work in evenings and on weekends, which the agency said in its quarterly performance report lowers on-time performance 2 to 3 percent. In part, that shows the wide margin Metro leaves for weekend and evening riders when trains are already scheduled less frequently.
The on-time scores — based on the time it takes to enter a station, wait the maximum amount of time scheduled for a train, ride to a destination, then exit the station — are above 90 percent on weekday evenings.
The average is around 88 percent at other times on weekdays, and 76 percent on weekends when single-tracking or shutdowns add up.
Overall from July to December, Green Line riders were again most likely to be on time (93 percent) while Blue, Orange and Silver Line riders were least likely to be on time (84 to 85 percent).
As part of efforts to increase ridership, Metro is hoping a promise of limited refunds for some significantly delayed riders and advertisements tied to the promise could convince former riders to come back or delayed riders to stick with the system
In the first seven days of the program, through Mon., Feb. 5, Metro said it had refunded 4,746 rush-hour rail trips that met all requirements.
Bus ridership drops
After the 14 percent fare hike to $2 for most bus trips, Metrobus rider revenue dropped 2 percent in the July-to-December period compared to the same period a year earlier.
Adjustments to bus schedules to reflect regular delays due to traffic or other causes have helped Metrobus on-time performance return to 78 percent, about the same level as two years earlier. All of Metro’s bus types are breaking down more frequently than last year though.
Metro blames part of the decline in reliability on the need to press older buses into more frequent service after 105 2014-model-year buses had to be pulled from service when they shut off while in motion. Separately, coolant sensors failed on the newest compressed natural gas bus fleet.
Smaller rail fare increases and more consistent rail rush hour ridership given reduced 24/7 work zones pushed rail rider revenue up 5 percent from last year, which is still short of Metro’s budget projections.
Metro now averages 604,000 rail riders each weekday, while weekend ridership dropped slightly again to an average of 202,000 per day. Bus ridership dropped 7.6 percent on weekdays to an average of 385,000 trips after the fare increase and rail service cuts. Weekend bus ridership fell 8.1 percent over the same time a year earlier to 166,000 per day.
Metro’s budget picture remains balanced since the agency has left many positions vacant and has spent slightly less on services contracts in the first six months of the budget year.
Including rail, bus and MetroAccess, riders took 145 million trips from July to December — 4.2 million fewer than the same period a year earlier.
MetroAccess on-time performance increased from 87 percent to 92 percent, the exact service level required by the contracts with the private companies that operate the paratransit system.
Metro paid the companies more to increase driver pay to fill a shortage after “operator staffing levels hemorrhaged” due to the low pay from the contractors.
MetroAccess carries an average of 8,000 trips each weekday.
Where you’ll find the most crowded trains, buses
The ridership drops are uneven, though, so riders can still face crowding on both trains and buses.
On the rails, Yellow Line trains going through Pentagon are consistently packed at around or above Metro’s maximum of 120 riders per car each morning.
The end of Yellow Line Rush Plus service in June, which offered a few additional rush hour trains in Virginia and additional trains through Columbia Heights to Greenbelt, added to the overall cut in scheduled service meant Green Line trains immediately became more crowded through the Shaw-Howard Univ. Station.
The crowding there hovers above Metro’s target of 100 riders per car at the busiest times, including sometimes nearing the 120 rider per car maximum.
In the afternoon, Yellow Line trains are similarly packed through L’Enfant Plaza, and Green Line trains are packed in through Mt. Vernon Square.
On the Red Line, crowding is worst at Gallery Place. On the Orange and Silver Line the crowding is worst at Courthouse and Rosslyn. In those cases though, Metro concludes the crowding hovers around target levels.
In the bus system, the most overcrowded lines in the District are the 79 express and 70 regular routes down Georgia Ave./7th Street; the 52, 53 and 54 down 14th Street; the 30S and 33 down Pennsylvania Ave. and Wisconsin Ave; and the W4 Deanwood-Alabama Ave. route.
In Maryland, the most crowded lines are the F4 between New Carrollton and Silver Spring; the K6 on New Hampshire Ave.; the Q4 on Viers Mill Rd; the, C4 and C2 between Greenbelt and Twinbrook; and the Y7 and Y8 down Georgia Ave.
In Virginia, the most crowded lines are the 28A down Leesburg Pike; 16Y Columbia Pike to Farragut Square line; 18P Burke Center; 38B, the Ballston-Farragut Square line; the REX Richmond Highway Express; and the 7Y Lincolnia-North Fairlington line.