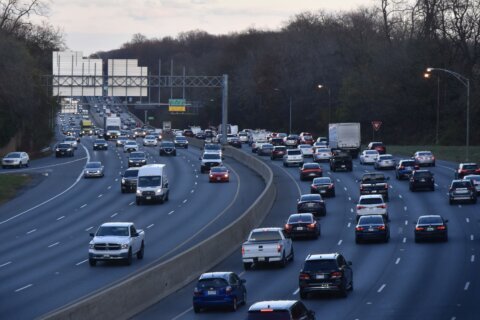
Uber and Lyft are not helping traffic in the D.C. region; they are hurting it, just like every other vehicle hitting the roads, finds a new analysis of the companies.
While most traffic across the area consists of freight, deliveries and people driving private cars, Uber and Lyft alone account for around 7% of the miles driven on District roads, and about 2% of miles traveled regionwide.
Nearly half of those miles are drivers on their own — without a single passenger in the car.
Added to general increases in driving over the last decade, Uber and Lyft appear to be enough to noticeably slow traffic.
“TNCs [i.e., transportation network companies] are likely contributing to an increase in congestion,” Uber’s Chris Pangilinan wrote.
“Transportation network company” is an industry term for ride-hailing services like Uber, Lyft and Via.
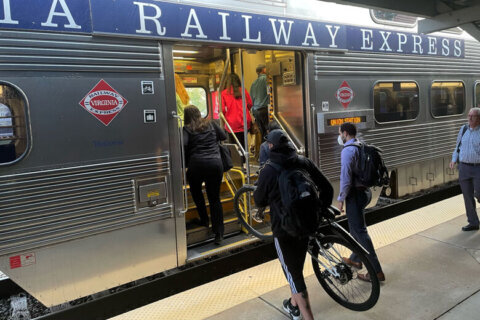
Such companies have been linked to declining Metro ridership, which could be not only due to apparent convenience for those who can afford it, but also due to the additional traffic buses are stuck in.
The number of Uber and Lyft trips could pass the number of bus trips in the region this year, and Metro is even supporting limited Lyft rides when the rail system is closed.
“As we continue to grow in the communities we serve, it’s important to understand how roads are being used so we can continue to work together with cities to develop the right policies that expand mobility,” Pangilinan wrote.
The analysis of September data provided by the companies, first reported by City Lab, includes wide swaths of the region — from Frederick and Calvert counties in Maryland to Prince William and Loudoun counties in Virginia.
The consultant’s analysis estimates that back in September, 83,040,000 miles were driven around the D.C. area by Uber and Lyft drivers with their apps actively turned on — either looking for a rider, going to pick someone up, or carrying riders to a destination. About 24 million of those miles were driven in D.C., mirroring a national trend of higher use or circling of drivers in denser areas.
Across the region, around 55% of the miles are with a passenger or passengers, while around 33% is cruising around waiting for a ride request. Around 10% is travel to pick up a rider.
In six cities covered by the study — Los Angeles, Seattle, San Francisco, Chicago, Boston and D.C. — that is about average for the proportion of miles driven carrying a passenger.
Numbers are not precise because the study attempts to account for cases where drivers have both Uber and Lyft apps active on their phones waiting for a trip request.
The D.C. area’s numbers are similar to Boston’s. The share of miles driven by Uber and Lyft drivers on San Francisco’s roads is higher — around 13%.
The numbers do not include miles in which drivers are traveling to or from a busier area without their app turned on.
Uber and Lyft believe the study may help push for a variety of changes in cities, from expanded use of scooters or other shared vehicles to congestion pricing.
The companies continue to lose money, despite carrying millions of trips.
Read more
Ride-hailing giants face bumpy road to profitability
‘Prosperity in Peril’: DC region bus study recommends significant changes
Too many cars? DC to consider tolls, congestion pricing