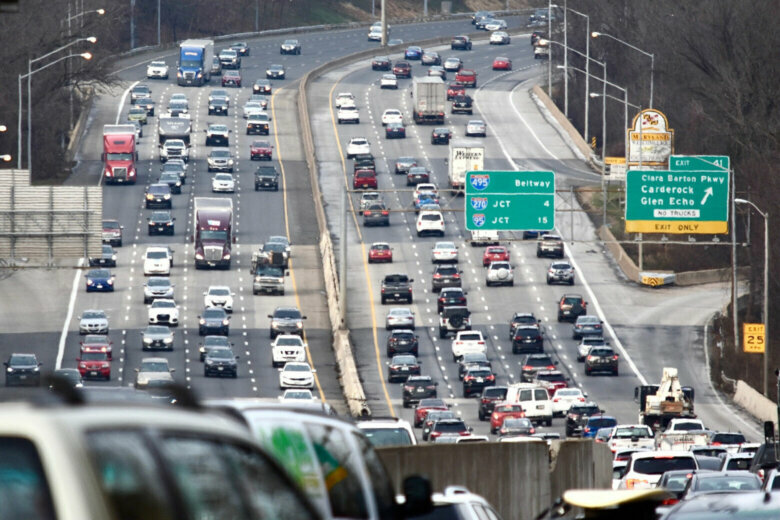
If your commute involves the 14th Street Bridge, you have good reason to tune to WTOP for traffic on the 8s. Inbound drivers on the bridge aren’t just headed for D.C., they’re also headed straight onto the most crash-prone stretch of road in the D.C. area, according to WTOP Traffic Center data.
Over the last four years, the WTOP Traffic Center recorded more than 91,000 crashes on the region’s interstates, federal parkways, state and local roadways. Doing this allows the traffic team to accurately report the latest traffic incidents you hear on air and see on the WTOP.com traffic page every day. Those tens of thousands of data points were used to generate a heat map for the region that shows hot spots where the frequency of crashes is higher compared to other parts of the area road network, as reported by WTOP.
The road shield icons on the map below denote the top five most crash-prone locations:
Spatial analysis of the traffic crashes shows portions of Interstate 395 in the District, Interstate 66 in Virginia and the Beltway in Maryland are among the most crash-prone sections of highway in the D.C. metro area.
The highest concentrations of crashes overall were centered near major highway interchanges where large volumes of traffic mix and multiple data sets overlap. Not surprisingly, the geographic distribution of crashes radiates outward from the metro area, with more crashes reported on highways in urban areas and fewer reported in rural areas.
Further analysis of the data compared total crashes recorded for individual highway segments. The highest number of crashes within one mile of any point per highway were compared.
No. 5
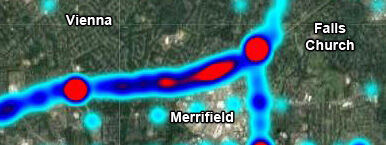
The fifth-highest concentration of crashes occurred in Virginia on I-66 between Nutley Street and the Beltway, where a maximum of 862 crashes was recorded. More than 80% of these crashes occurred in the eastbound lanes.
Most of the crashes happened in the right lanes, and were associated with drivers weaving in and out of the merge lanes for the Beltway. The ongoing project associated with the construction of Express Lanes will also add a fifth general-purpose lane for merging near the Beltway.
A sharp gradient between high and low crash frequency was visualized on I-66 near the Beltway. Few crashes were reported on I-66 between I-495 and Route 7.
No. 4
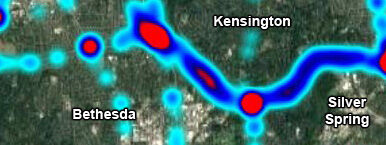
In Montgomery County, Maryland, a maximum of 954 crashes was recorded on the curvy section of the Beltway between I-270 and Connecticut Avenue. According to the Maryland Department of Transportation, this part of the Beltway averages around 182,000 vehicles per day.
No. 3
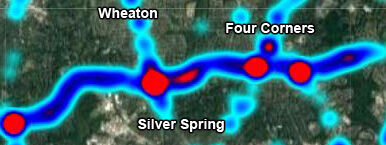
The third-highest frequency of crashes was observed on the Beltway between Georgia Avenue and Colesville Road. On this section of I-495 in Silver Spring, just under 1,000 crashes were recorded. About two thirds of these crashes occurred on the Outer Loop.
No. 2
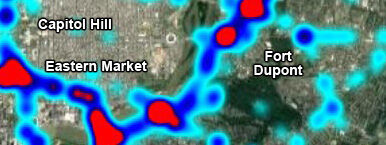
Slightly more than 1,000 crashes were recorded on a section of D.C. Route 295 between Pennsylvania Avenue and Benning Road, with the highest concentration occurring near Pennsylvania Avenue. Unlike its interstate counterpart to the south, Route 295 between the 11th Street Bridge and Eastern Avenue has short acceleration lanes, tight clover leaf ramps and short service road slip ramps.
No. 1
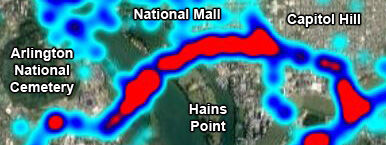
The highest frequency of crashes for any single stretch of highway was found on I-395 in the District. From the 14th Street Bridge across the Southwest Freeway, nearly 1,700 crashes were logged over the past four years.
The rate of crashes on this two-mile portion of interstate exceeded one per day, significantly higher than any other portion of road in the region. Up to five crashes were recorded on some days.
With limited safety pull-off areas, incidents on this urban freeway typically cause significant traffic backups.
The data show about two-thirds of the crashes on I-395 involved northbound drivers heading into the District.
The segment of freeway extends from the notoriously crash-prone interchange for the George Washington Parkway in Virginia to the Southwest Freeway’s ramp for the 3rd Street Tunnel in D.C. In an effort to reduce driver confusion and curb the recurring crashes near the tunnel, the District Department of Transportation is renumbering the entire Southeast-Southwest Freeway as I-395.
Dishonorable mentions
The heat map depicts crash-prone sections of the George Washington Parkway near Key Bridge and the southern end of the Baltimore-Washington Parkway near Kenilworth Avenue. The rock walls and railings along both parkways have been severely damaged by repeated crashes in these locations.
A hot spot is also evident near 11th Street Bridge and the ramps connecting I-295 and D.C. 295 to I-695.
Where the numbers come from
Incidents on roads in the D.C. region are collected and verified in real time by the WTOP Traffic Center around the clock. Every known crash, including those not mentioned on air, is entered into a database on a 24/7/365 basis.
The data set used for this analysis consists of more than 91,000 crashes spanning four years, from Dec. 1, 2017 to Nov. 31, 2021.
The severity of the incidents ranged from brief-duration property damage crashes to those that involved fatalities.
The data set is not all-inclusive but it does capture some crashes that were not documented by public agencies. In the District, it is estimated that nearly a third of crashes involving pedestrians and cyclists go unreported to authorities.
Each data point is verified to the best of the department’s ability. The attributes of only a small percentage of the data are believed to be subject to error. Data quality issues are primarily limited to input of duplicate entries, incident classification and default coordinates for the nearest exit in lieu of manual adjustments that would represent a more precise incident location.
Some crash scenes that comprised separate collisions were combined into a single incident. Some minor secondary crashes were omitted.

