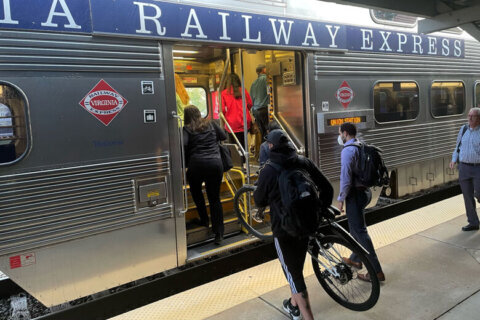
WASHINGTON — Metrorail riders looking for a seat may want to try the Yellow Line, and riders on the Blue Line need to hold their breath to squeeze onto trains through Rosslyn, according to a new report from Metro.
“Crowding increased on Red, Orange, Blue and Silver Lines as not enough railcars were available for service,” according to Metro’s 2015 Vital Signs Report, to be presented to the Board of Directors Thursday.
There are fewer Blue Line trains now than before the service changes leading up to the Silver Line’s opening were implemented. Instead, several trains to and from Franconia-Springfield are routed over the Yellow Line bridge during rush hours.
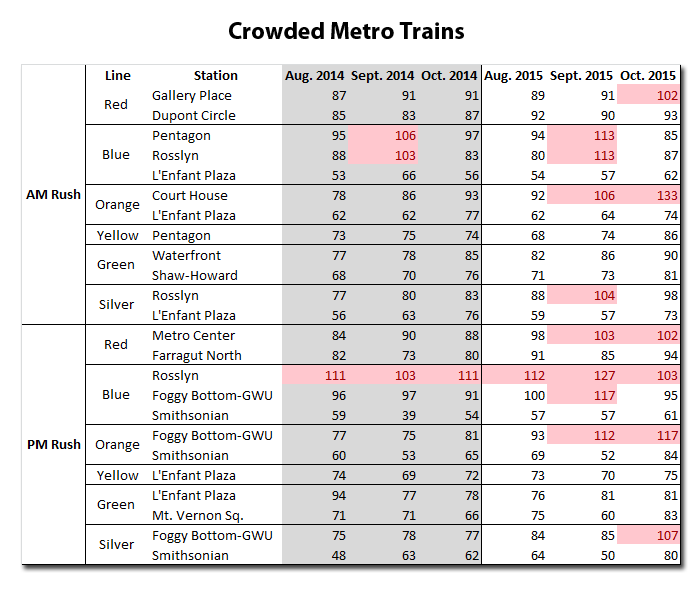
The crowding through the Rosslyn Tunnel impacts the Blue Line most severely in the afternoon rush hour, according to Metro estimates, with the Orange and Silver lines also exceeding Metro crowding targets in September and October as service was cut for months due to a transformer fire near Stadium-Armory.
Metro ideally wants 100 passengers per car, with a minimum of 80 and a maximum crowd of 120.
As many as 127 people crammed into Blue Line trains at Rosslyn at points in September, and 117 packed in at Foggy Bottom in the afternoon. On the Orange Line, 133 people packed into single cars at Court House in October.
The Red Line also has seen significant crowding through Gallery Place and Metro Center as well.
The points with the least crowding are on the eastern side of the system, with fewer rush hour riders through L’Enfant Plaza.
In addition to longer waits on platforms and sometimes uncomfortable rides, more crowded cars on the Red, Orange, Blue and Silver lines mean that Metro spends more money powering its trains. This, combined with the declining efficiency of Metrobuses that run on compressed natural gas, kept Metro from reaching its goal of using less power in 2015 than the year before.
DELAYS:
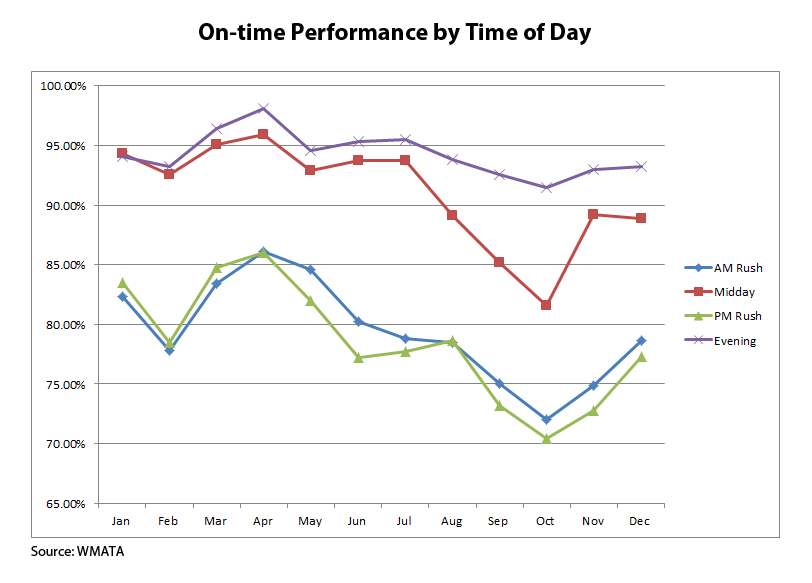
Overall, Metro says trains were on time 79.6 percent of the time during the morning rush hour last year, and 78.8 percent of the time during the evening rush hour. In the middle of the day and at night, both times that Metro runs far fewer trains, Metro says on time performance was above 90 percent.
However, Metro measures on-time performance based on whether trains are evenly spaced.
The ratings do not measure how long a trip actually takes riders. Metro is planning to introduce a new measure soon that would more closely reflect the actual experiences of riders.
Metro’s Yellow Line, the shortest in the system, was the most likely to have trains meet on-time performance goals last year. The Orange and Silver Line nearly tied for the most delayed followed closely by the Blue Line.
The intersections of the three lines at East Falls Church, Rosslyn and Stadium-Armory mean any delay on one line impacts the others. The Green Line also fell below 85 percent on-time performance.
Metro scores overall Red Line on-time performance for the year at 89.3 percent.

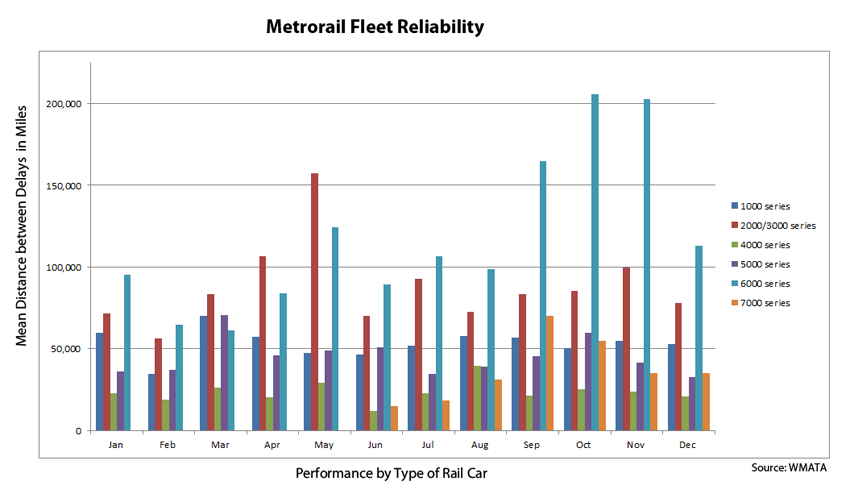
Also, the report shows the newest 7000 Series cars go about 35,000 miles between delays. That is better than Metro’s least-reliable railcars, the 4000 Series, but worse than all other Metro Series of cars. Metro says the reliability of the 7000 series will improve as the cars are broken in. Metro’s contract for the cars specifies they must go more than 150,000 miles between delays.
Many of Metro’s delays and the overcrowding on trains have been tied to the increase in the number of cars needed to operate full service after the Silver Line opened, and an increase in the number of cars stuck in yards due to maintenance problems or delays. While sources tell WTOP Metro has made progress on addressing parts shortages that significantly delayed maintenance on some other cars, there are still dozens of cars sitting in rail yards awaiting repairs. In 2015, Metro says it fell short of its rail fleet availability target in nine out of 12 months, with railcar shortages a regular rush-hour issue.
On the plus side, Metro is now running more of the newer 7000 Series railcars than they needed for the Silver Line expansion, which could help ease daily railcar shortages.
“2015 Rail Fleet Reliability was 13 percent worse than last year, as more aging railcars were removed from service for causes including propulsion, door and brake issues,” the report says.
Metro says overall improvements across the system will require significant work. Also, it will require hiring people to fill “operations-critical” roles. As of the end of the year, 11.1 percent of those positions are vacant. Metro has a target vacancy rate for the positions of 9 percent.