Nearly half the counties in the U.S. are areas where federal health officials say the impact of COVID-19 on the health system is high, and masks are recommended indoors.
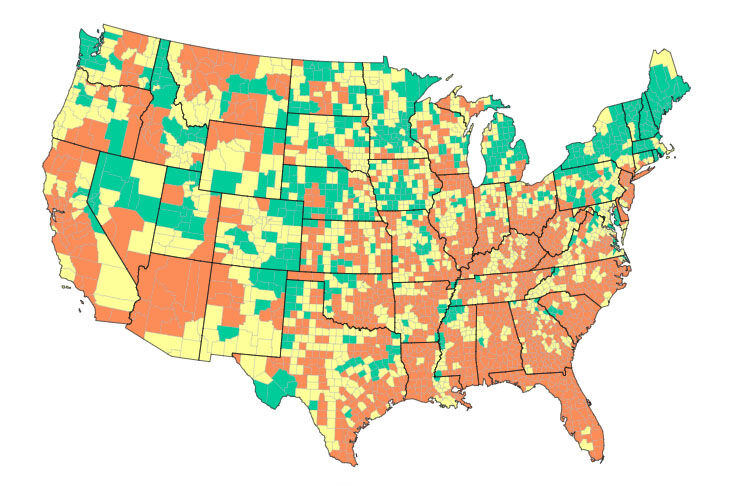
A map of the U.S. on the Centers for Disease Control and Prevention website shows large pockets of orange across the U.S., indicating counties at the high level. About 45% of counties are in the high level, according to the CDC data. About 36% of U.S. counties are in the medium level, and about 19% at the low level.
At the high level, everyone — regardless of vaccination status — is recommended to wear a mask indoors, per CDC guidelines.
But while those levels are high in other parts of the U.S., the D.C. region has been spared — at least so far.
Most of the D.C. region remains at the medium level, at which people are encouraged to check with their doctors about wearing a mask in indoor public areas if they are at high risk of severe illness. Some areas remain at the low level.
Last week, Montgomery County, Maryland, the state’s most populous county, said its data indicated they had reached the high level based on hospitalization metrics. However, that conflicts with CDC data. (More on that below.)
Given the shifting case numbers, it’s possible even a modest uptick in COVID-19 cases or hospitalizations could tip a number of other counties in the D.C. area to the high category.
Here’s everything you need to know about COVID-19 community levels.
What are COVID-19 community levels?
The CDC rolled out its system of measuring community levels in March as a way to measure the impact of COVID-19 on health and health care systems, and to help public health officials make decisions about health recommendations.
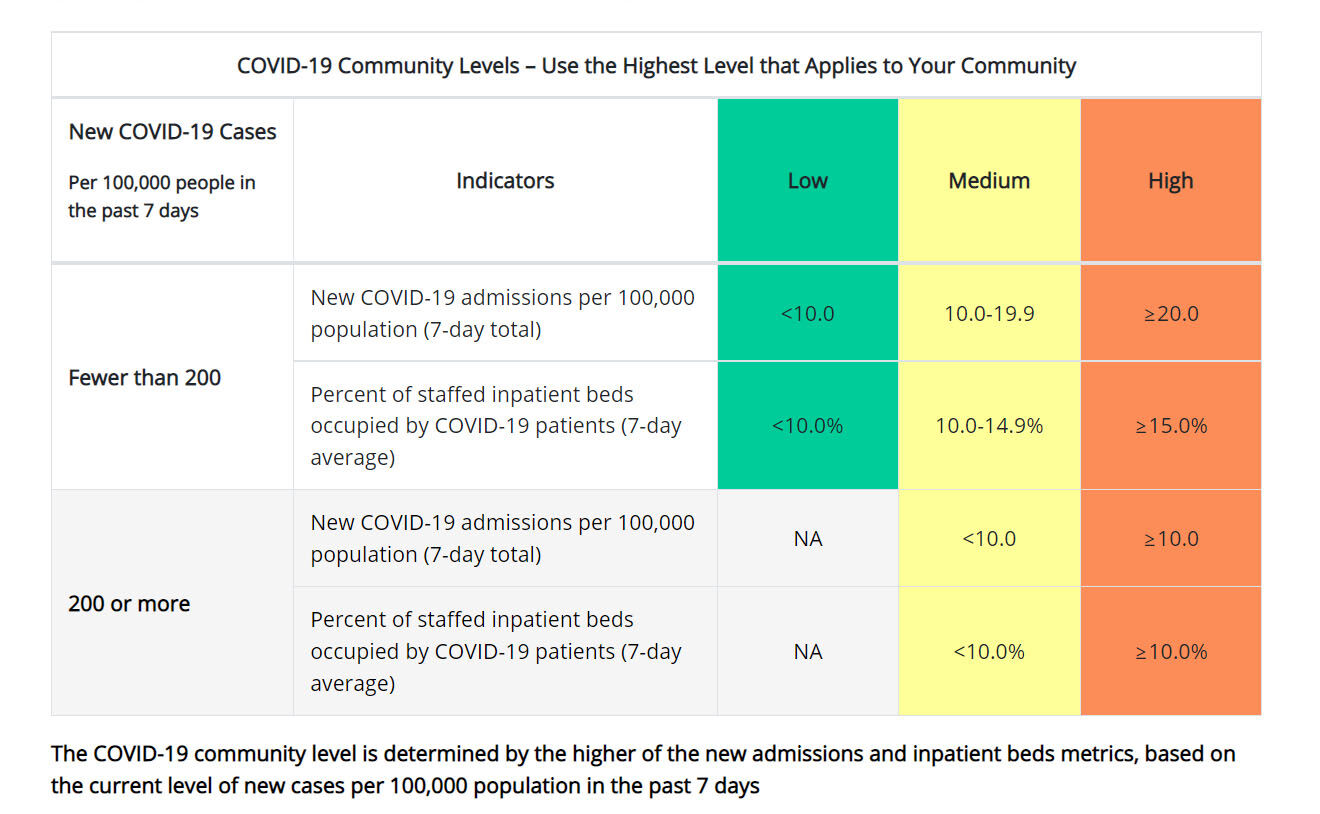
The CDC’s COVID-19 community levels are made up of three factors: the number of new COVID cases and two metrics related to hospitalizations.
The first metric is the number of new cases per 100,000 residents in the past seven days. If the figure is below 200, that puts an area in the low range (unless hospitalizations are at very high level). If the number of cases is above 200 cases per 100,000 residents, that puts an area in the medium level.
At that point — once there are more than 200 new cases per 100,000 residents — the focus shifts to hospitalizations. There are two hospitalization metrics: new COVID-19 admissions per 100,000 residents and the percentage of staffed hospitals beds occupied by COVID patients.
If the number of new COVID admissions per 100,000 residents goes above 10, that puts an area into the high category. If the percentage of staffed hospital beds occupied by COVID patients goes above 10%, that also puts an area into the high level.
The CDC’s metrics for hospitalizations don’t only include hospitals in one particular county — they are for total hospitalizations in what CDC refers to as a Health Service Area, which is a group of jurisdictions. For example, the Health Service Area that includes Montgomery County also includes Prince George’s, Charles and St. Mary’s counties. The Health Service area for Fairfax County, Virginia, also includes Alexandria City and Arlington and Loudoun counties.
At the medium level, CDC says people with a high risk of developing severe illness should talk with their doctors about whether they should wear a mask indoors around others. At the high level, CDC says everyone should wear a mask indoors in public areas.
Here is a look at the COVID-19 community levels for counties around D.C. based on CDC data, which is uploaded weekly. The most recent data is from July 28.
DC
Level: Low
Case rate per 100,000 population: 194.83
New COVID-19 admissions per 100,000: 9.5
% staffed inpatient beds in use by patients with confirmed COVID-19: 5.7%
Virginia
Arlington County
Level: Medium
Case rate per 100,000 population: 315.4
New COVID-19 admissions per 100,000: 7.9
% staffed inpatient beds in use by patients with confirmed COVID-19: 5.2%
Fairfax County
Level: Medium
Case rate per 100,000 population 227.44
New COVID-19 admissions per 100,000: 7.9
% staffed inpatient beds in use by patients with confirmed COVID-19: 5.2%
Loudoun County
Level: Low
Case rate per 100,000 population: 198.29
New COVID-19 admissions per 100,000: 7.9
% staffed inpatient beds in use by patients with confirmed COVID-19: 5.2%
Prince William County
Level: Medium
Case rate per 100,000 population: 254.29
New COVID-19 admissions per 100,000: 3.3
% staffed inpatient beds in use by patients with confirmed COVID-19: 3.6%
Maryland
Montgomery County
Level: Medium
Case rate per 100,000 population: 232.9
New COVID-19 admissions per 100,000: 9.5
% staffed inpatient beds in use by patients with confirmed COVID-19: 5.7%
Prince George’s County
Level: Medium
Case rate per 100,000 population: 230.28
New COVID-19 admissions per 100,000: 9.5
% staffed inpatient beds in use by patients with confirmed COVID-19: 5.7%
Howard County
Level: Medium
Case rate per 100,000 population: 190.06
New COVID-19 admissions per 100,000: 12.8
% staffed inpatient beds in use by patients with confirmed COVID-19: 5%
Charles County
Level: Medium
Case rate per 100,000 population: 218.06
New COVID-19 admissions per 100,000: 9.5
% staffed inpatient beds in use by patients with confirmed COVID-19: 5.7%
Anne Arundel County
Level: Medium
Case rate per 100,000 population: 178.34
New COVID-19 admissions per 100,000: 12.8
% staffed inpatient beds in use by patients with confirmed COVID-19: 5%
What’s going on with Montgomery County’s level?
Last week, health officials in Montgomery County said their data indicated the county had tipped over into the high category.
The county maintains its own COVID-19 data dashboard, which is updated daily. None of the county’s regulations changed, but County Executive Marc Elrich urged residents to wear masks indoors, in line with the CDC recommendations.
However, a few days later, the county acknowledged a discrepancy between its data and the CDC data, which continued to show Montgomery County at the medium level even after its most recent update July 28.
On Friday, the Montgomery County Department of Health and Human Services said on Twitter the discrepancy between county and CDC data stems from the fact that the CDC does not count hospital admissions at the county’s Adventist hospital site, which operates as an alternate care site for monoclonal antibody infusions and other COVID-19 treatments.
“Data inconsistencies” between county and CDC data have occurred, especially “when we hovered between levels,” the department said in a tweet. “We apologize for any confusion. Bottom line — there is no change to current COVID regulations — safe practices are always recommended.”
On Monday, the health department also said a “data source error” last week had mistakenly elevated the number of hospital admissions. The corrected data still showed Montgomery County at the high level.
Heading to the beach?
If you’re planning a beach vacation, be aware that some of the popular destinations are now at the high level. Ocean City, in Maryland’s Worcester County, remains at the medium level, but all three Delaware counties have reached the high level.
Sussex County, which includes Rehoboth, Bethany and Lewes beaches, had previously been at the medium level but was updated to the high level.