U.S. climate scientists say they expect a weak El Niño to affect weather patterns this winter. A similar weather pattern hit D.C. in 1977 was one of the coldest winters recorded on the East Coast.
␎ ![globe.jpg]()
WASHINGTON – Now that we have established that the summer of 2014 in the D.C. region wasn’t quite as cool as we had
perceived it to be, we can now move on to the winter of 2014-2015. Does a cool
summer mean a harsh winter? I have been getting this question a lot,
especially as we head into the end of October.
The Climate Prediction Center issued its Winter
Outlook Thursday saying to expect a weak El Niño to affect weather
patterns this winter. Generally for the D.C. area, weak El Niño winters
averaged below normal temperatures and precipitation.
Let’s take a look at the differences between these weather phenomenon and the
results they have triggered in winters past.
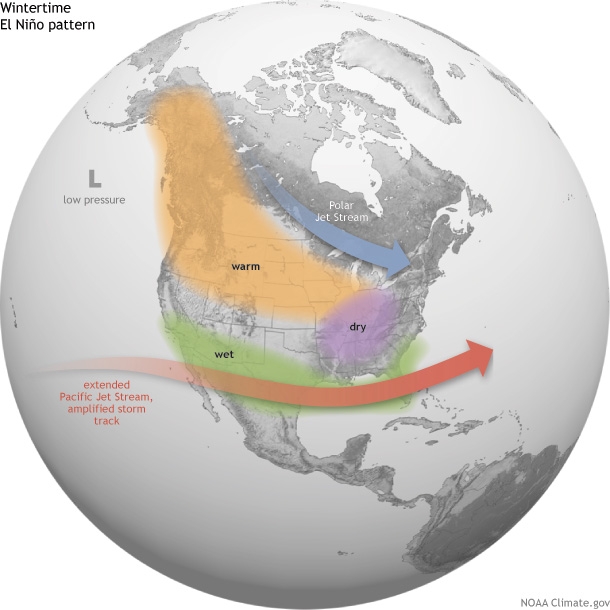
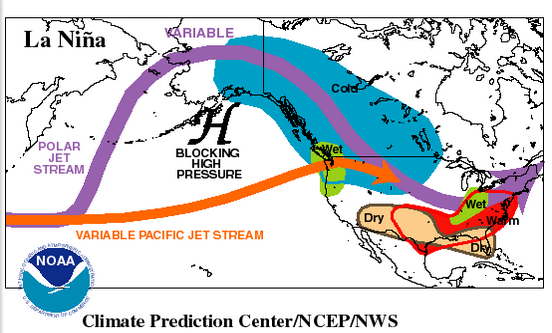
El Niño vs. La Niña vs. Neutral
These events often dictate the patterns of precipitation and temperatures
globally.
This meteorological phenomenon represents the correlation between the sea
surface temperatures and the atmosphere in the eastern Pacific.
According to NASA’s definition of these events, “the development of El Niño
events is linked to the trade winds. El Niño occurs when the trade winds are
weaker than normal, and La Niña occurs when they are stronger than normal.”
El Niño: Warm water builds up and migrates along the equator in the
eastern Pacific creating unusually warm temperatures. This warms the
atmosphere creating thunder and rain storms.
La Niña: Cool water builds and migrates along the equator causing
unusually cool temperatures in the eastern Pacific. This event cools the
atmosphere and less water evaporates creating fewer rainstorms in response to
the cooler and drier, dense air.
Neutral: This is the period (like 2013-2014) when neither La Niña nor
El Niño is present. This can be chalked up as a likely transition period to
either a La Niña or El Niño event. Most indicators, such as ocean temps,
tropical rainfall patterns and atmospheric winds, are right around average.
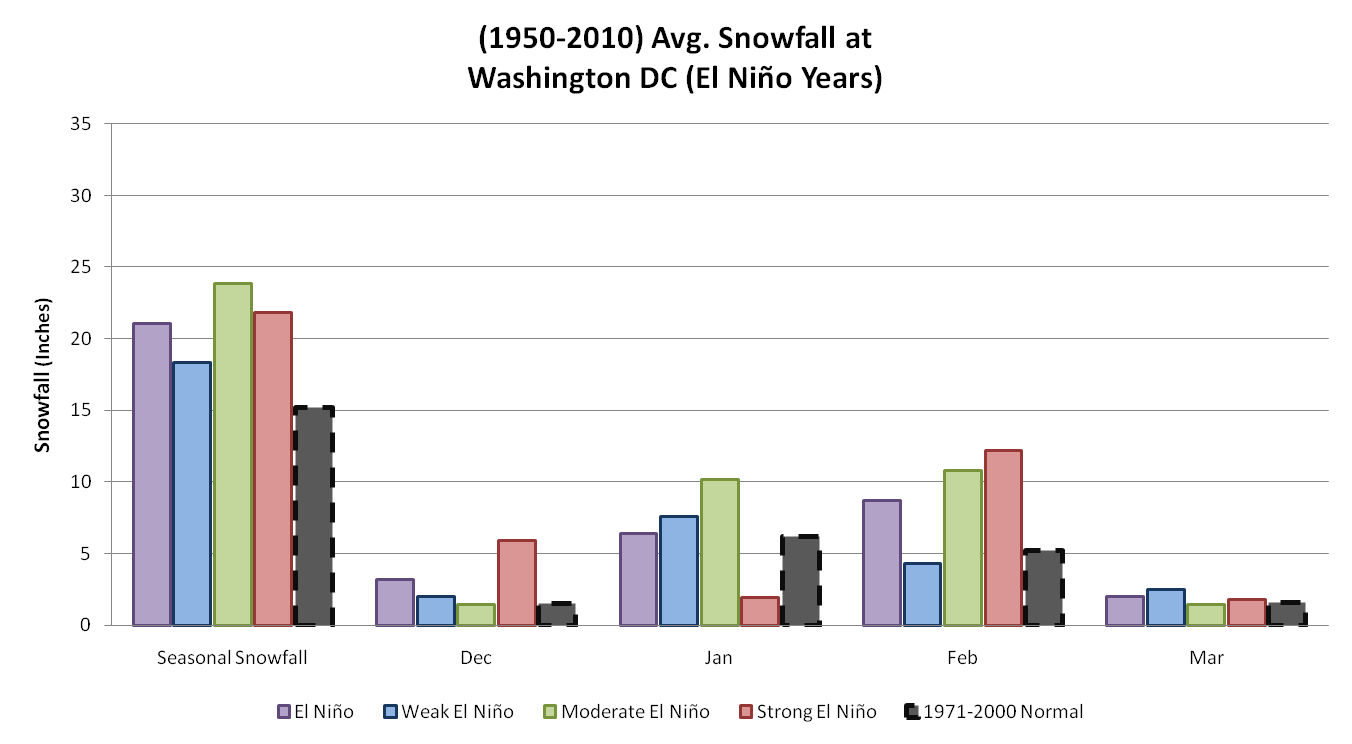
According to the National Weather Service, weak El Niño winters featured below
normal temperatures and precipitation on average. But strong El Niño years
experienced temperatures that were warmer and wetter than typical winters.
“The stronger the El Niño episode, the warmer and wetter the winters have
been,” according to the National Oceanic and Atmospheric Administration.
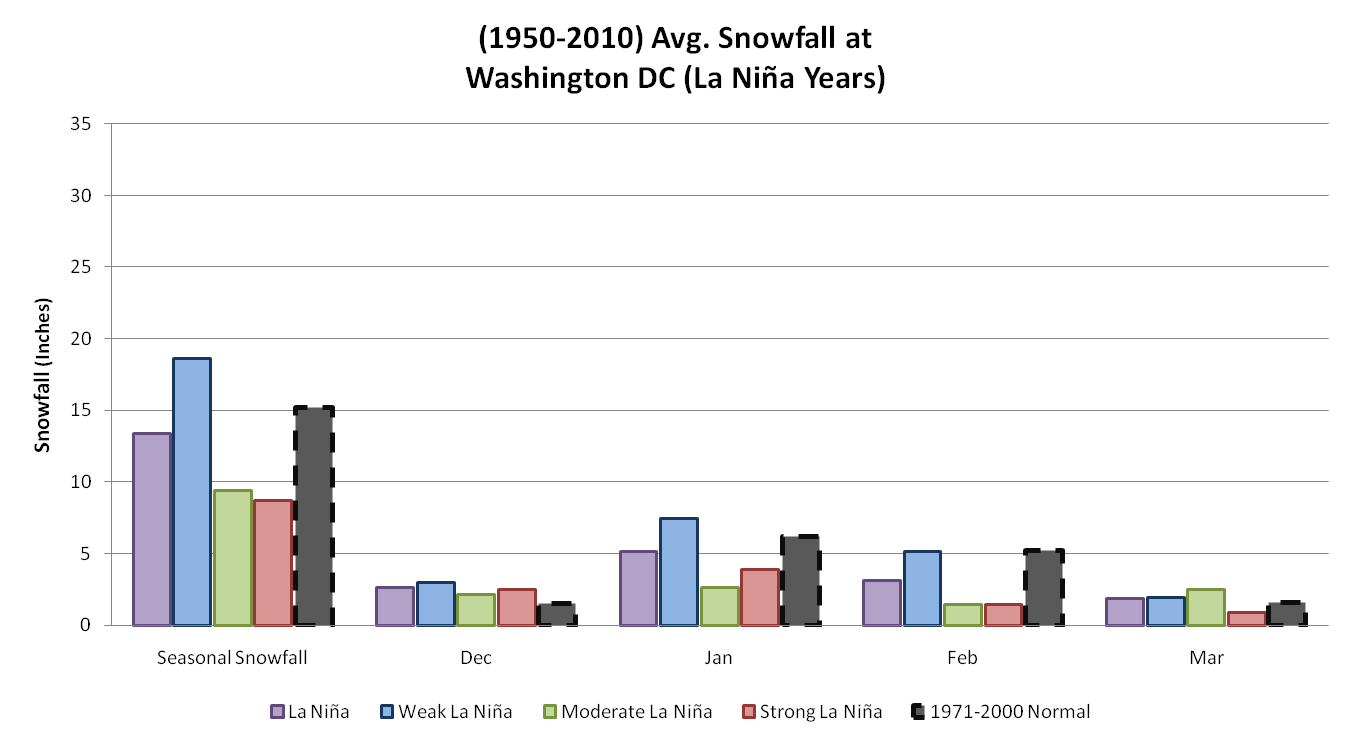
Among the winters that I analyzed, I only recorded one that was considered a
weak La Niña from 1995-1996. Approximately 20 winters were influenced by La
Nina episodes since 1950. According to the weather service, the stronger the
La Niña, the warmer the temperatures averaged in D.C. and Baltimore. Almost
all of the La Niña episodes are linked to near or below normal snowfall in
D.C. and Baltimore. However in January 1996, a blizzard dropped 17.1 inches of
snow on the District during a weak La Niña.
This winter
So what’s in store for the end of 2014 through the spring of 2015 in terms of
El Niño/La Niña?
The Climate Prediction Center has issued a statement that it expects a 67
percent chance of a weak El Niño to develop from October 2014 through December
2014 and to continue through early 2015. Right now, observations in the
Pacific are consistent with neutral conditions (same as last year), but there
is a high chance of transitioning to most likely a weak El Niño event or a
slight chance of a low-end moderate El Niño.
The Climate Prediction Center also forecasts that a repeat of last winter’s
extreme pattern is unlikely this year.
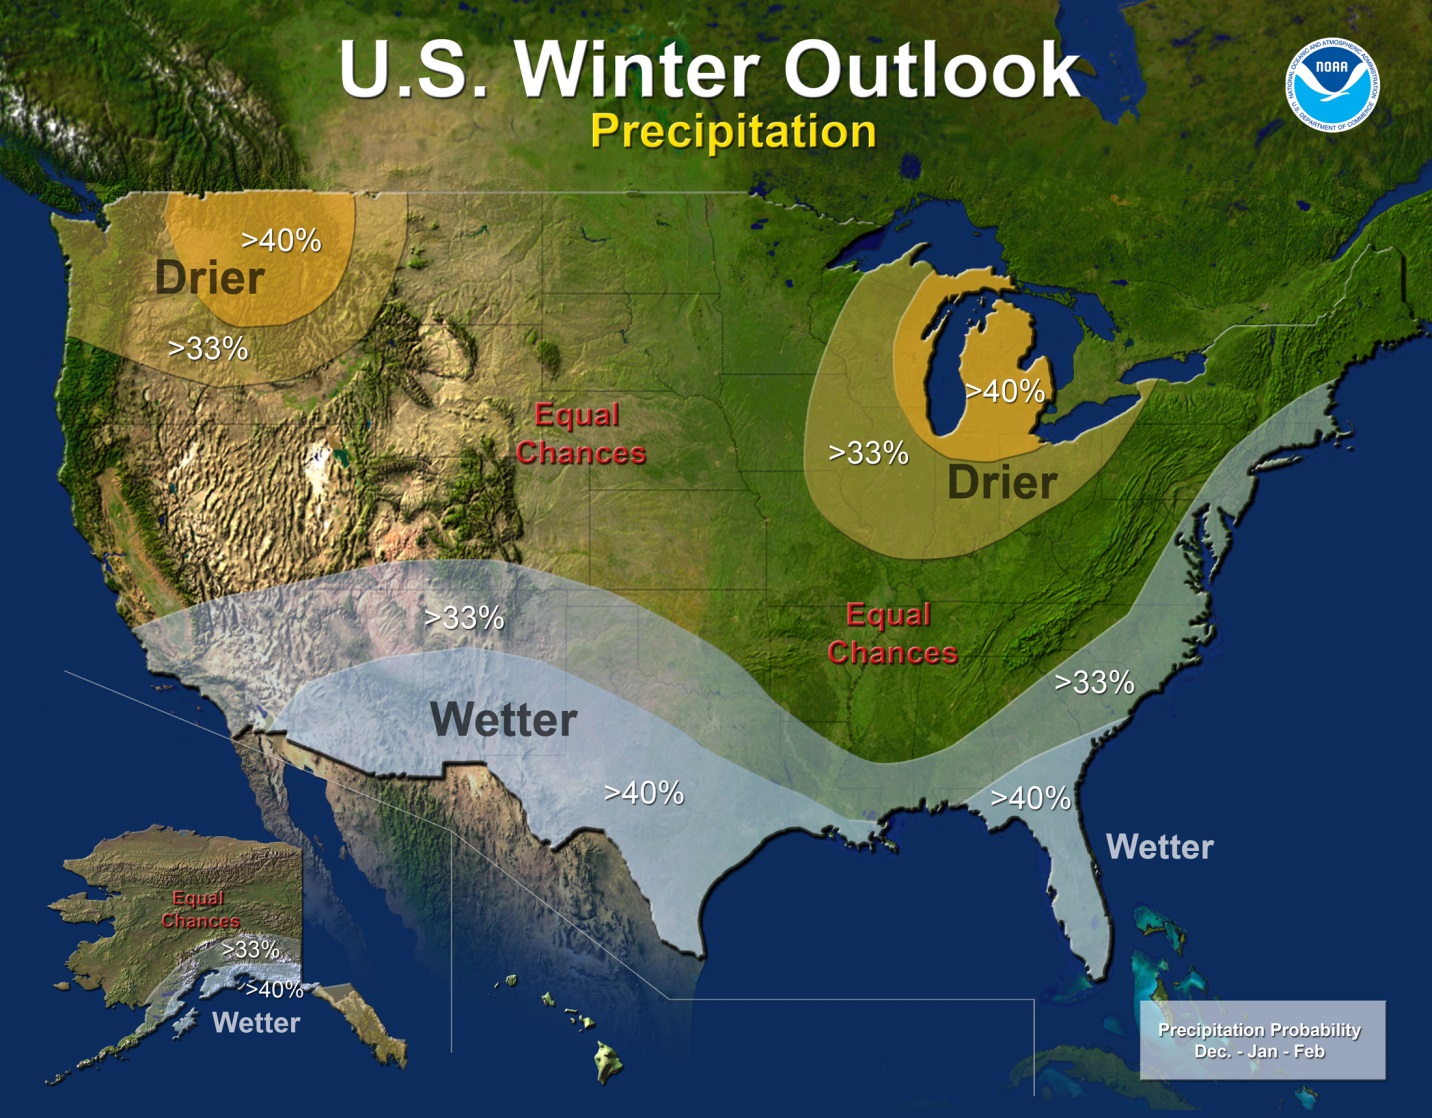
Based on the forecast of a weak El Niño forming, east of the Blue Ridge
Mountains favors a better chance (greater than 33.3 percent) of a wetter than
average winter.
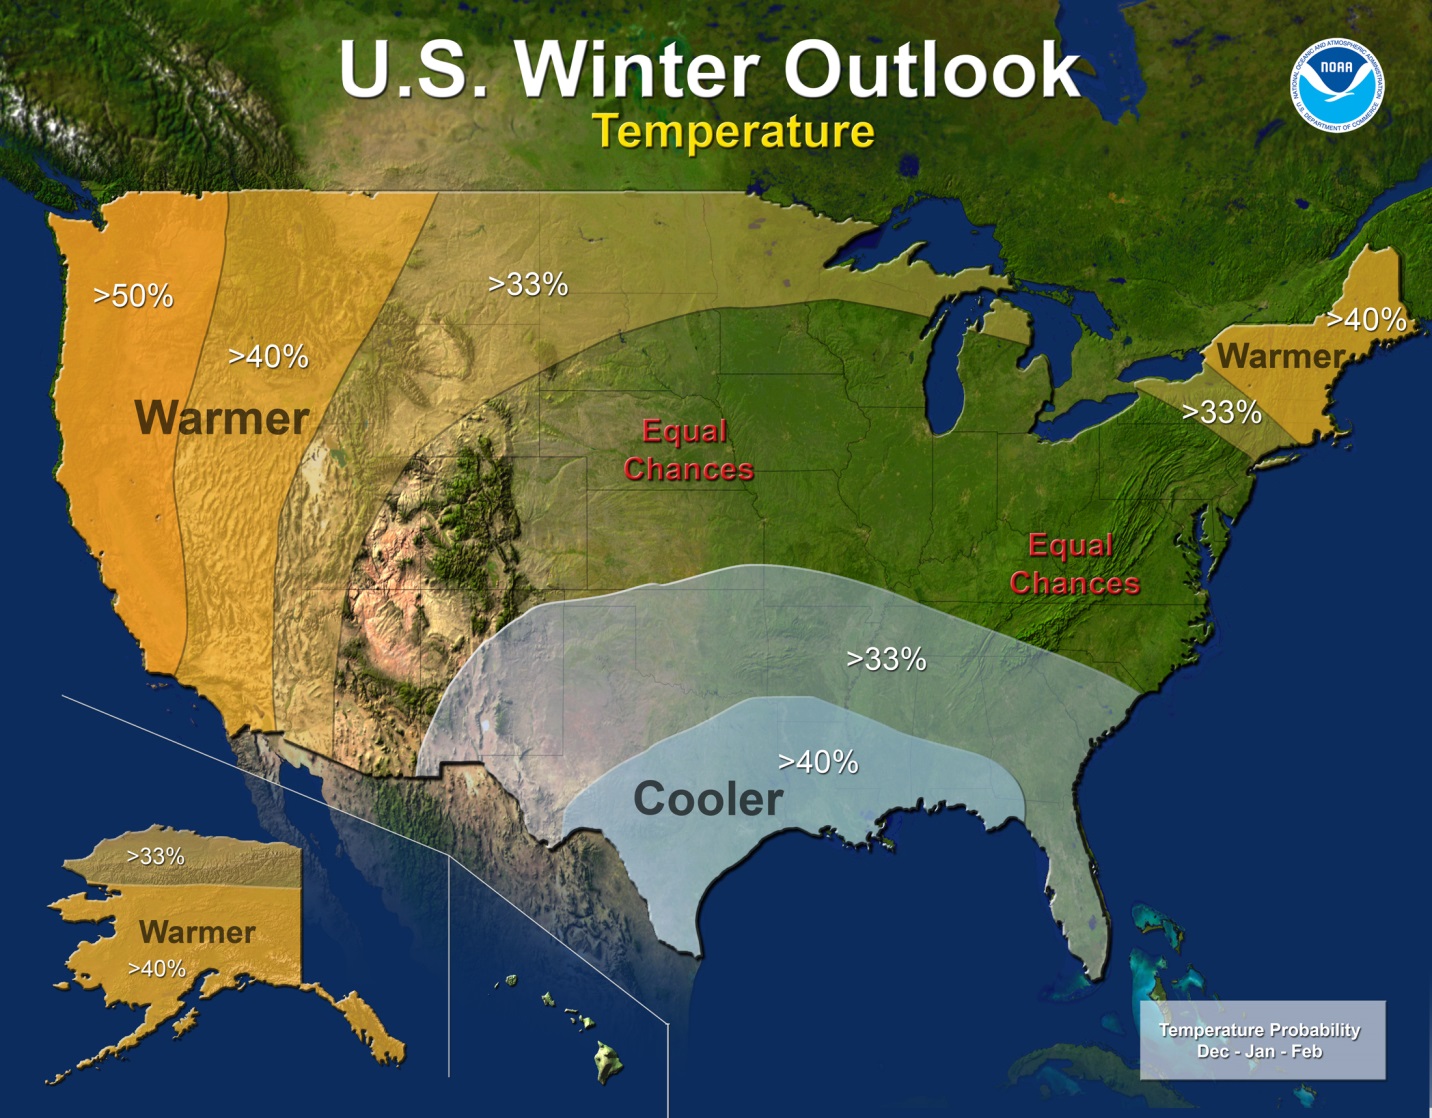
As for temperatures, the Mid-Atlantic falls in the “equal chance” category,
meaning that there was not enough of a consensus within the climate to
generate a forecast for a long-term temperature prediction. Therefore, they
have an equal chance for above/near/below normal temperatures. However,
historically — as we know from the information above — generally for the
D.C. area, weak El Niño winters averaged below normal temperatures and
precipitation.
So there is the information and honestly we are just touching the surface as
to what goes into a seasonal forecast: historic trends in both the winter and
the summer; the Pacific Ocean temperature; wind movement; contrast and
comparison. So if we happen to see a weak El Niño develop, maybe check back
and see how that compares to the winter of 1977. Hopefully
it won’t be like that year.
Washington’s worst winters
I analyzed all of the harsh winters Washington D.C. has recorded since 1899
and tried to find exactly what the summer preceding that harsh winter was like
in terms of temperature and whether we were experiencing a La Niña year, an El
Niño year or a neutral year to give us an idea of what the long-range winter
forecast will bring. The data are all from the D.C. forecast office (it moved
a couple times throughout the past 115 years but was always located within the
District of Columbia).
|
1899: The Great Eastern Blizzard of
’99
This storm moved into the Washington D.C. region on Valentine’s Day, a Tuesday
in 1899. Snow was reported as far south as Florida with around 21 inches of
snow falling on the D.C. and Baltimore area and up to 16.0 inches as far north
as New York. Gusty winds that accompanied the blizzard caused serious snow
drifts that blocked transportation lines into D.C. causing a coal shortage.
The Washington area had a snow depth of 34 inches. This was the winter of
The Great Arctic Outbreak, during which temperatures were so cold across much
of the United States that the National Weather Service reports that ice flowed
from the Mississippi River into the Gulf of Mexico.
|
Summer 1898:
With an average summer temperature of 75 degrees and an observed temperature
of 76 degrees, the meteorological summer of 1898 (June – August) was 1 degree
warmer than average. |
January 28, 1922 “Knickerbocker Storm”:
This storm was a crushing blow to the D.C. area. A heavy snow of 28 inches was
measured in D.C. with higher amounts around the regions. This was the infamous
“Knickerbocker Storm.” About 100 people were crushed to death as the roof at
the Knickerbocker Theater on 18th Street and Columbia Road in NW D.C.
succumbed to heavy snow.
|
Summer of 1921:
The summer preceding the “Knickerbocker Storm” was 0.83 degrees warmer than
average, but just by a very thin margin. The average temperature was 74.6
degrees for the summer of 1921. |
April 1, 1924 “Aprils Fools Day Storm”
While this storm was mild in comparison with other storms of the past, this
was the latest snowfall of the season of this amount. (This was considered a
major snow storm because it accumulated more than 4 inches). Actually 5 inches
of snow fell on the Washington area. Baltimore received 9 inches of snow with
this storm.
|
Summer of 1923
The summer of 1923 was once again just a touch on the warmer side with the
average temperature for the summer at 74.6 degrees and an observed temperature
for the three summer months was 75.2 degrees. This means that D.C. was 0.63
degrees warmer the summer before the April’s Fools Day Storm. |
February 7, 1936
While this storm does not have a name, the spring following this winter helped
set up for “The Great Spring Flood of March 1936,” which was recorded as one
of the worst floods for the Potomac River and Washington D.C. More than 14
inches of snow fell around D.C. with higher amounts through the Eastern Shore,
Southern Maryland and south. All that snow helped lend to the massive flooding
of the Potomac River through the spring.
|
Summer 1935
Temperatures for the summer of 1935 were at 74.6 degrees for an average. The
summer was very warm with temperatures topping out at 1.95 degrees above the
normal temperature! |
March 29-30, 1942
The “Palm Sunday Snowstorm” was a late bloomer, moving in at the end of March.
However, it was a big snow producer dropping a foot of snow on Washington D.C.
That was a minimal total compared to Baltimore, which received the most snow
accumulated with one storm in 20 years! Baltimore recorded 22 inches of
snow and Hagerstown measured 22 inches of snow as well in about 24 hours!
|
Summer 1941
Chalk it up as another warm summer around Washington D.C. with temperatures
1.0 degrees warmer than average. The average temperature for the summer of
1941 was 74.6 degrees with the observed temperature at 75.6 degrees. |
January 30-31, 1966
Strong El Niño Year:
A pretty bad winter was upon the D.C. region during 1965-1966. With snow
already on the ground, a blizzard came whisking through the region dropping 1
to 2 feet of snow through Virginia and Maryland. D.C. recorded 14 inches
of snow while Baltimore received just around a foot. There were some higher
totals through Fredericksburg and Manassas.
|
Summer 1965
The summer leading up to the fairly bad winter was almost near normal. The
average temperature for the summer of 1965 was 76.3 with a recorded
temperature of 76.0 degrees. That means the summer of 1965 was 0.3 degrees
BELOW average, slightly just still below. |
January of 1977 The
Bicentennial Winter
Weak El Niño Year:
This was one of the coldest winters recorded on the East Coast. The average
temperature in Washington for January was 25.4 degrees, which was the coldest
since 1856 when the average temperature was 21.4 degrees (the normal
temperature for January was 34.6 degrees). The Carter Administration was
settling into Washington and starting on Jan. 4, snow kept falling every few
days. It was just a few inches here and a few inches there. Believe it or not,
the Tidal Potomac (which is salt water) was frozen solid due to the cold
temperatures. People could actually skate across it to the Memorial Bridge!
This winter was terrible for everybody – in fact, snow was even seen in Miami
on Jan. 19.
|
Summer 1976
Looking back at the summer of 1976, the average temperature was just slightly
normal for the meteorological summer, only 0.8 degrees warmer. The average
temperature for those months was 76.8 degrees and the D.C. area measured a
summer with an average temperature of 77.6 degrees. |
February 18-19, 1979
Neutral Year:
The “Presidents Day Storm” was a storm thought to be the worst to hit the
D.C. region in 57 years. Snow was recorded as falling 2 inches to 3 inches per
hour during the storm! One of the most interesting facts about this storm is
that there was a protest on the National Mall with tractor trailers and other
large farm machinery to protest for higher agricultural pricing. The
protesters on the mall ended up using their equipment to help people dig out
of the mounds of snow that were around 2 feet deep.
|
Summer 1978
With another bad winter upon the D.C. area in 1979, the summer of 1978 was a
hot one. Temperatures were 2.1 degrees above normal! The average summer
temperature for that summer was 78.7 degrees and the Washington D.C. area
observed a warm average temperature of 78.9 degrees. |
February 11-12, 1983
Strong El Niño Year:
Up to this point in history, the February storm of 1983 was the second
greatest snowfall on record for the D.C. region as 24-hour snowfall records
were set in some of the surrounding areas and D.C. received 17 inches of
snow with this storm. There was more snow if you traveled outside the city,
snowfall totals were up to 2 feet in some areas. Not only was the region
dealing with large snowfall totals but gusty winds also caused large snow
drifts around the Mid-Atlantic.
|
Summer 1982
The summer preceding the snowstorm that beat out the Presidents Day Snowstorm
was actually slightly cooler than average. The average temperature for the
summer of 1982 was 76.8 degrees and D.C. observed a temperature of 76.2
degrees. That means D.C was 0.6 degrees below normal for that summer. |
November 11th, 1987 “The Veteran’s Day
Storm”
Moderate transitioning into Strong El Niño Year: The snow came down
fast a furious and took people by surprise considering these were the days
before Doppler radar. By the time the snow moved through Fredericksburg,
dropping heavy amounts, it was too late and meteorologists didn’t even really
grasp what was happening until snow reached the forecast office in Camp
Springs. Around a foot of snow fell across the region as motorists were still
out and about. Stranded cars speckled area roadways.
|
Summer 1987
This was actually a very warm summer in 1987 and an early massive snowstorm
followed. Temperatures in the summertime were 2.2 degrees above normal. The
average temperature for that summer was 77.0 degrees and D.C. topped out at
79.2 degrees! |
March 13th – 14th 1993 “The Superstorm of
March ‘93”
Coming out of Moderate El Niño this was a Neutral Year: This was a
massive storm, with the lowest pressure ever recorded at the storm’s center
that affected the entire East Coast. Not only did it cause a huge storm surge
through the Florida panhandle and several tornadoes (several deaths resulted
in those weather events as well), it dropped more than a foot of snow across
multiple states. Although this was an incredible storm, D.C. has seen worse.
D.C. recorded 13 inches of snow with almost a foot right outside the city. In
the suburbs and in extreme Southwest Virginia some totals reached around 40
inches. There were plenty of strong winds accompanying the storm as well. This
was a true blizzard. Snow drifts were higher than 12 feet, the National Guard
was called in and there were several deaths reported from hypothermia,
collapsed roofs but more commonly from overexertion leading to heart attacks
while shoveling snow.
|
Summer 1992
I wouldn’t exactly call the summer of 1992 a warm summer as temperatures in
the Washington D.C. area were 1.9 degrees below average. The average
temperature for that summer was 77.0 degrees and D.C. measured a temperature
of only 75.1. June and August were particularly cooler. |
Winter 1994
Neutral Year: Several ice storms pelleted the D.C. area early in 1994
and temperatures plummeted below zero several mornings. This is thought to be
the iciest winter on record for the D.C. area. During January and February,
there were multiple storms that dropped sleet, snow and freezing rain as well.
One storm in particular on Feb. 10 left a coating of ice that was 1 to 3
inches thick across the region. The thick coating of ice downed trees and
pulled down power lines causing power outages. There was a disaster
declaration given in our area and several injuries were reported as a direct
result of the heavy ice coatings.
|
Summer 1993
The summer of 1993 was a warm one with temperatures 1.3 degrees above average.
The average temperature was 78.0 degrees and the D.C. area observed a warm
temperature of 79.3 degrees. |
January 7-13, 1996: The Blizzard of ’96
Weak La Niña Year: Another one for the record books, another one in
recent memory. If you were north and west of the District, you were dealing
with almost 40 inches of snow in some areas while D.C. topped out around 20
inches of snow. Just as the roads started to clear, an infamous “Alberta
Clipper” came diving into our area out of the northwest bringing another shot
of several inches of fresh snowfall. And then, just when we thought it was
over, a third storm moved into the area piling on another 4 to 6 inches of
snow in the District with more to the north and west of D.C. All in all,
around 2 to 3 feet of snow accumulated after these series of storms.
|
Summer 1995
Another warm summer preceded a nasty and snowy winter with temperatures in the
summer of 1995 1.1 degrees above normal. The average temperature was 78.03
degrees and we measure a temperature of 79.13 degrees bringing us a summer
that was 1.1 degrees above average. |
February 15-17, 2003
Moderate El Niño Year: Moving into the 21st century, another strong
storm was moving up the eastern seaboard in mid-February while temperatures
were measuring in the teens. As this Nor’easter was developing, heavy snow
began to fall into the overnight and early morning hours on February 16th. The
snow continued through Presidents Day morning, Feb. 17 with totals in D.C.
topping out at 26.8 inches of accumulation.
|
Summer 2002
Another very warm summer was on tap for the region as temperatures were 2.3
degrees above normal for the meteorological summer! The average temperature
for that summer was 77.03 degrees in D.C. while temperatures warmed up to
79.36 degrees! |
Winter of 2009-2010
Moderate El Niño Year: Here we go. The winter that never quit and the
first time I had to get on air and say, “We are going to see 30 to 35 inches
of
snow in spots.” This was one of many weekend storms we saw that winter with
snow rates at 2 inches per hour at times. That was the first storm that came
through on Dec. 18 and Dec. 19. By January, we had our fair show of little
storms
that dropped more than 5 inches in spots at times. Then came a blizzard on
Feb. 5 and Feb. 6. That storm dropped 17.8 inches in D.C. and more than 3 feet
of
snow north and west of town. Then, just when we thought we had enough, we got
another blizzard on Feb. 9 and Feb. 10. D.C. received an additional 10.8
inches of
snow with up to 2 more feet recorded in areas. That winter, D.C. saw 56.1
inches of snow fall. That is the No. 1 winter for snowfall in the D.C. area
since records were kept beginning in the late 1800s!
|
Summer 2009
The summer of 2009 was pretty much average. Yes, temperatures were just
slightly cooler but only by 0.2 degrees. The average temperature for the
summer of 2009 was 77.0 and we reached 76.8 degrees with a pretty warm August
on tap to help close the deficit from a cooler than average June and July.
Therefore, we were 0.2 degrees below average for the summer of 2009. |
Winter of 2013/2014
Neutral Year: Another winter that never ended! I couldn’t believe that
we were seeing St. Patrick’s Day snow. It was the middle of March and we had
been dealing with minor snow events since December. We had a least nine snow
events last winter that resulted in several inches of snow. Eventually, Ronald
Reagan Washington National Airport saw a total of 32 inches of snow for the
season, but that
does not even fall into the top five snowiest winters for D.C.
|
Summer 2013
The summer last year was just slightly warmer than the average summer. The
average summer temperature for June to August is 77.7 degrees and D.C. warmed
up to 78.3 degrees for all three months combined. That is 0.6 degreesa above
average. |
Related Stories:
Follow @WTOP on Twitter and WTOP on Facebook. You can also
follow
Lauryn Ricketts on Facebook.