This article was republished with permission from WTOP’s news partner InsideNoVa.com. Sign up for InsideNoVa.com’s free email subscription today. Read the article on Inside Nova.

New numbers from Prince William County Public Schools show a mixed bag of academic progress during the 2021-2022 school year and persistent racial gaps in dropout, graduation and discipline rates.
According to the 2022 State of the Schools Report, the school system’s on-time graduation rate fell, while college math readiness declined year-over-year, although uptake on advanced courses and standardized test scores improved from the hybrid-learning 2020-2021 school year.
Presented by Tim Neall, the school system’s director of research, accountability and strategic planning, at the Oct. 19 School Board meeting, the newest division report included hundreds of data points tracking student performance, survey results and staffing information alongside the 2025 goals for each metric according to the division’s four-year strategic plan.
While state Standards of Learning test results for the 2021-2022 school year have been available since August, the report included other standardized data points on student learning that had not been publicized.
“You can see moments of growth, where performance is increasing. Students are taking some of those advanced courses, the post-secondary plans are being created,” Neall said. “But you can also see our gaps, gaps in our performance groups in our English learners, gaps with our Hispanic students, gaps with our students with disabilities.”
One new metric for the division’s strategic plan is grade-level reading according to the Houghton Mifflin Harcourt assessment. The division’s goal is that by 2025, 80% of elementary students will be reading on grade level by third grade. However, last year, only about 66% of all students were reading on or above grade level by the end of second grade, according to the assessment.
Graduation rates, college readiness
In terms of graduation, the division’s on-time graduation rate dropped to a six-year low, with 91.74% of students graduating within four years. That was down from 92.38% in the 2018-19 school year and 92.78% in the 2020-21 school year. Hispanic students had the lowest on-time graduation rate among the division’s ethnic groups at 84.7%.
As for non-ethnic student groupings, economically disadvantaged students and English learners fared well below the rest in terms of on-time graduation, something that persists throughout the division’s various data points. The division’s 2025 goal is to reach 95% on-time graduation.
For those students who do graduate, the division’s goal is to have 60% meet reading and math “college readiness” benchmarks according to the SAT by 2025.
But the learning loss that sent math scores tumbling farther than others in elementary and middle school has seemingly lasted into high school. Last year, just 50% of the division’s graduates met college readiness benchmarks in math, down from 54% the previous two years. Black students were the only cohort whose scores improved over the past three years, but their scores still lagged behind other groups on average, with just 34% meeting the benchmarks.
Reading SAT scores, on the other hand, were significantly higher than 60% for all groups other than students with disabilities and English learners.
Recovering from pandemic disruptions
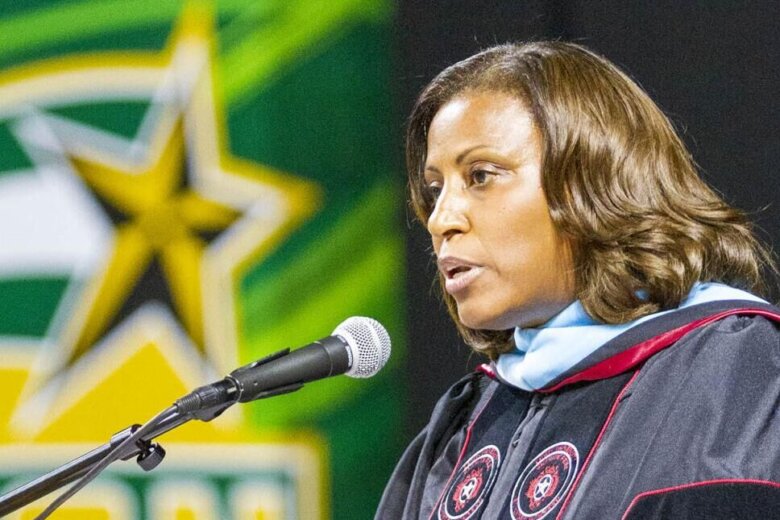
Superintendent LaTanya McDade, in her second year on the job, has repeatedly insisted to the School Board and parents that recovering from the educational impacts of the COVID-19 pandemic will be a multi-year process. A report released by the academic assessment nonprofit NWEA over the summer suggested that elementary school students might need at least three years to get back to where they would have been academically without the pandemic. For middle schoolers, the report said, it could take five years.
Just this week, the fourth to eighth grade test results from National Assessment of Education Progress – called the “nation’s report card” – showed the biggest decline on record for math scores.
For county schools, though, there were other metrics the school system’s leadership has prioritized in its strategic plan that have trended positively since the start of the pandemic. The percentage of students completing advanced or dual enrollment courses jumped from 38% in 2019-20 to 46% in 2021-22, with increases across all ethnic groups and classifications. And the number of students earning qualifying scores on AP, IB and Cambridge exams increased, along with the number of students earning an industry credential or seal of biliteracy.
Dropout rates
Chronic absenteeism and dropout rates, meanwhile, continue to see wide discrepancies between student groups, with both metrics increasing for the worse in the 2021-22 school year.
“We … have a goal of reducing our dropout rate by 10%, this is primarily focused on our hispanic students and our English learners,” Neall said.
Division-wide, dropout rates jumped from 5% in 2020 to 6.1% in 2022, but the distribution among groups is far from even. Among Hispanic students, the dropout rate climbed from 11.4% to 12.3%. And for English learners, the trend is even more worrisome, with dropout rates jumping from 18.9% in 2020 to 24.4% in 2022.
“We do have groups that are in the double-digits, which is very concerning,” said Gainesville School Board Member Jennifer Wall. “And so, we know now, this data is actually very informative because it helps us know where we can target our efforts to keep those kids in school, make a difference in their lives.”
Another metric with wide variability was exclusionary discipline rate. On the whole, the division’s discipline rate was 5%. But for Black students, that number was 6.8% in 2021-22. That represented a 1.8 percentage point drop from 2018-19, but was still the highest among all ethnic groups. Students with disabilities had a discipline rate of 7.2%, while the rate for economically disadvantaged students was 6.1%.
“Our numbers are not where they should be,” said Woodbridge School Board Member Loree Williams said. “I think it’s important that the public know that we’re actively working and continuously working and evolving our practices to make this equitable for all of our students. Because it’s not acceptable to have a smaller portion of our population receive more disciplinary action than other groups.”
McDade said the division’s priority was to reduce exclusionary discipline across the board.
“We are actively working with schools to reduce exclusionary discipline, especially through restorative practices,” McDade said. “It is one of the areas of focus based on the strategic plan goals as well as what we’re seeing in individual school communities.”
One other reason for concern: a decrease in employee retention rates. While teachers supporting the ongoing collective bargaining push have long said that working conditions are worsening and time pressures are increasing for the division’s educators, the report included data that showed a slight increase in employee attrition. From the 2018-19 school year to 2020-21, the system’s certified employee retention rate increased from 91.2% to 93.1%. But last school year, that number fell to 90.1%.