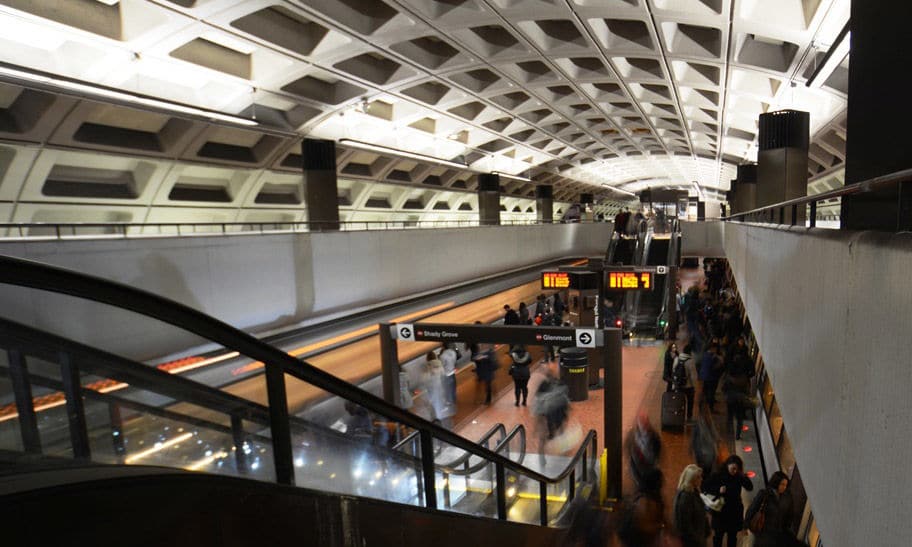
Metro ridership grew significantly this May compared with last year, but remains well below historic highs a decade ago, according to data obtained by WTOP.
The average of 643,530 weekday rail system entries May 2019 nearly matches 2016 levels, just before Metro’s 24/7 track work began. The peak historical May ridership was around 750,000 from 2008 to 2010.
Metro uses the month of May to bench mark ridership numbers.
While an increase of nearly 20,000 daily weekday boardings in May of this year compared with May of last year is a positive sign, the summer-long Blue and Yellow Line shutdown cut into ridership again starting in June.
Usage had been lower in the last six months of 2018.
Metro has yet to formally release its ridership and performance data for April, May and June of this year, but detailed spreadsheets reviewed by WTOP show the full year of rail ridership, including the times of day people tend to use each of the system’s 91 stations.
In the District, overall weekday entries and exits into the rail system are relatively balanced each month, with the most weekday entries during the afternoon rush, and the most exits in the morning rush.
In both Virginia and Maryland, Metro recorded around 2,000 to 3,000 more entries per weekday than exits from the rail system at stations there, suggesting that a small but significant number of people might Metro one way, but use another mode of transport, such as a cab, bus or Uber/Lyft, to get home. The data don’t provide answers as to why that might be – shorter hours, decreased frequency of trains late at night, or simply convenience or alternate destinations, could all be explanations.
The data on the busiest times of day for entries and exits at each station largely track what you might expect: Stations downtown have the most riders exiting in the morning rush and entering in the evening rush, while end-of-line stations see the reverse.
At Dupont Circle and Farragut North, where chiller systems were broken for several years until just last week, more than 7,000 people waited for trains in the afternoon rush at Dupont, but more than 3,000 waited for trains on the hot platforms in the morning, midday and evening periods.
At Farragut North, the weekday boardings are much more lopsided — more than 16,000 entries during the evening rush in June, compared to just 1,319 in the morning rush; 3,553 in the middle of the day; and 3,496 in evenings.
Farragut West, Gallery Place, Metro Center and L’Enfant Plaza show a similar skew to rush-hour commuting.
Some stations see less of a midday dropoff, though.
Union Station remains Metro’s busiest, with nearly 30,000 entries and exits each day, ahead of Metro Center, L’Enfant Plaza, Gallery Place, Farragut North, Farragut West and Foggy Bottom. The station is slightly busier in the afternoon rush than in the morning rush.
In Virginia, the Pentagon station averages around 14,000 entries and exits each weekday, ranking it and Rosslyn ahead of Pentagon City, Crystal City, Ballston, Vienna and Wiehle-Reston East.
In Maryland, Silver Spring and Shady Grove each see around 11,000 riders each weekday. Silver Spring is somewhat more balanced over the course of the day, while Shady Grove is heavily commuter-based. Bethesda and Friendship Heights, on the D.C.-Maryland border, are the next busiest stations.
On Saturdays, Pentagon City has the most station entries and exits in Virginia, followed by Reagan National Airport, Rosslyn and Vienna.
The busiest Maryland stations on Saturdays tend to be Silver Spring, Shady Grove, Greenbelt, New Carrollton, Prince George’s Plaza, Friendship Heights and Bethesda.
Some stations tend to be extremely quiet on weekends though. On Sundays, fewer than 200 people on average use Cheverly; Landover sees around 300; Eisenhower Avenue fluctuates, but goes as low as around 200 per Sunday in a given month, while Spring Hill is around 300, West Falls Church is around 450, Deanwood is around 400, and Capitol Heights is around 400.
The numbers
Find out when your Metro station is typically busiest in the tables below. The tables show average weekday data for April for simplicity and to eliminate ridership periods that are skewed by a 24/7 shutdown.
Still, usage varies somewhat by time of year. For example, stations such as Smithsonian tend to have higher ridership than usual in April due to spring break tourists and cherry blossoms.
| D.C. Stations | AM ENTRY |
MID | PM | EVN | TOTAL ENTRY | AM EXIT |
MID | PM | EVN | TOTAL EXIT |
|---|---|---|---|---|---|---|---|---|---|---|
| Anacostia | 2,402 | 1,473 | 1,574 | 371 | 5,819 | 1,313 | 1,159 | 2,383 | 1,075 | 5,930 |
| Archives | 296 | 1,430 | 5,544 | 1,056 | 8,327 | 4,514 | 2,506 | 933 | 213 | 8,166 |
| Benning Rd. |
1,400 | 661 | 404 | 140 | 2,604 | 211 | 420 | 1,212 | 545 | 2,389 |
| Brookland | 2,074 | 1,402 | 1,862 | 528 | 5,867 | 1,298 | 1,225 | 2,250 | 967 | 5,740 |
| Capitol Heights | 1,194 | 377 | 230 | 82 | 1,882 | 101 | 229 | 1,014 | 347 | 1,691 |
| Capitol South |
938 | 1,563 | 4,109 | 777 | 7,386 | 3,820 | 2,258 | 1,329 | 410 | 7,818 |
| Cleveland Park |
2,042 | 967 | 761 | 352 | 4,122 | 280 | 879 | 2,080 | 930 | 4,168 |
| Columbia Heights |
4,117 | 2,525 | 3,191 | 1,287 | 11,119 | 1,998 | 2,146 | 4,754 | 2,376 | 11,275 |
| Congress Heights |
1,159 | 621 | 472 | 154 | 2,406 | 250 | 401 | 1,082 | 445 | 2,178 |
| Deanwood | 675 | 326 | 210 | 71 | 1,282 | 136 | 211 | 579 | 244 | 1,170 |
| Dupont Circle |
3,373 | 3,388 | 7,541 | 3,202 | 17,504 | 6,057 | 4,148 | 5,562 | 1,942 | 17,709 |
| Eastern Market |
2,141 | 1,360 | 1,522 | 744 | 5,767 | 948 | 1,290 | 3,034 | 987 | 6,258 |
| Farragut North |
1,127 | 3,449 | 15,524 | 3,462 | 23,562 | 14,243 | 6,022 | 2,560 | 563 | 23,388 |
| Farragut West |
1,448 | 3,179 | 13,428 | 2,988 | 21,042 | 13,388 | 5,277 | 2,659 | 540 | 21,864 |
| Federal Center SW |
383 | 1,075 | 4,272 | 381 | 6,111 | 3,915 | 1,616 | 513 | 152 | 6,196 |
| Federal Triangle |
161 | 1,362 | 5,651 | 799 | 7,974 | 4,755 | 2,428 | 662 | 96 | 7,940 |
| Foggy Bottom |
2,075 | 3,671 | 10,180 | 3,860 | 19,786 | 8,807 | 5,105 | 4,615 | 1,273 | 19,800 |
| Fort Totten |
4,071 | 1,736 | 1,733 | 462 | 8,001 | 1,030 | 1,237 | 3,737 | 1,850 | 7,854 |
| Gallery Place |
1,774 | 3,696 | 12,334 | 6,547 | 24,351 | 9,988 | 5,612 | 6,450 | 2,049 | 24,100 |
| Georgia Ave. |
2,998 | 1,395 | 1,445 | 495 | 6,333 | 843 | 924 | 2,647 | 1,416 | 5,830 |
| Judiciary Square |
320 | 1,459 | 4,716 | 635 | 7,130 | 4,542 | 2,173 | 733 | 150 | 7,597 |
| L’Enfant Plaza |
2,669 | 3,616 | 13,891 | 1,717 | 21,892 | 12,330 | 5,444 | 3,267 | 562 | 21,603 |
| McPherson Square |
1,743 | 2,251 | 9,129 | 1,701 | 14,825 | 8,682 | 3,506 | 2,424 | 667 | 15,278 |
| Metro Center |
1,679 | 4,273 | 15,535 | 4,717 | 26,203 | 12,983 | 7,556 | 4,461 | 1,033 | 26,033 |
| Minnesota Ave. |
882 | 629 | 596 | 149 | 2,256 | 405 | 509 | 944 | 421 | 2,278 |
| Mt. Vernon Square |
1,232 | 907 | 1,806 | 860 | 4,806 | 1,365 | 1,127 | 1,813 | 706 | 5,011 |
| Navy Yard |
1,776 | 1,610 | 5,270 | 2,987 | 11,642 | 4,397 | 2,122 | 4,035 | 1,243 | 11,797 |
| NoMa-Gallaudet | 3,098 | 1,953 | 4,224 | 785 | 10,061 | 3,311 | 1,707 | 3,110 | 1,354 | 9,483 |
| Potomac Ave. |
1,973 | 856 | 591 | 204 | 3,624 | 313 | 515 | 1,714 | 701 | 3,243 |
| Rhode Island Ave. |
2,446 | 1,322 | 1,013 | 358 | 5,139 | 661 | 1,032 | 2,407 | 962 | 5,064 |
| Shaw-Howard U. |
1,526 | 1,076 | 1,521 | 703 | 4,826 | 911 | 1,043 | 1,877 | 896 | 4,728 |
| Smithsonian | 291 | 2,757 | 8,374 | 1,420 | 12,841 | 4,935 | 6,220 | 1,935 | 279 | 13,368 |
| Stadium-Armory | 1,209 | 550 | 544 | 141 | 2,444 | 351 | 403 | 1,067 | 455 | 2,275 |
| Takoma | 2,888 | 1,164 | 887 | 265 | 5,204 | 477 | 686 | 2,715 | 1,102 | 4,979 |
| Tenleytown | 1,675 | 1,477 | 2,209 | 908 | 6,269 | 1,553 | 1,618 | 2,661 | 942 | 6,774 |
| U Street |
1,874 | 1,095 | 1,681 | 1,296 | 5,945 | 997 | 1,086 | 2,708 | 1,228 | 6,019 |
| Union Station |
9,836 | 5,306 | 11,205 | 2,951 | 29,297 | 9,368 | 6,293 | 11,737 | 1,879 | 29,277 |
| Van Ness |
2,489 | 1,382 | 1,425 | 573 | 5,870 | 783 | 1,163 | 2,489 | 1,110 | 5,544 |
| Waterfront | 1,440 | 1,007 | 1,434 | 614 | 4,494 | 1,009 | 914 | 1,775 | 818 | 4,515 |
| Woodley Park |
2,538 | 1,970 | 2,090 | 698 | 7,295 | 857 | 2,003 | 2,893 | 1,289 | 7,043 |
| D.C. April total |
79,428 | 72,315 | 180,127 | 51,438 | 383,308 | 148,123 | 92,214 | 106,820 | 36,216 | 383,372 |
| Md. Stations | AM ENTRY |
MID | PM | EVN | TOTAL ENTRY | AM EXIT |
MID | PM | EVN | TOTAL EXIT |
|---|---|---|---|---|---|---|---|---|---|---|
| Addison Rd. |
1,820 | 547 | 216 | 112 | 2,694 | 161 | 360 | 1,655 | 582 | 2,759 |
| Bethesda | 3,067 | 1,941 | 3,397 | 923 | 9,328 | 2,739 | 1,616 | 3,498 | 1,499 | 9,352 |
| Branch Ave. |
4,290 | 743 | 374 | 127 | 5,534 | 223 | 489 | 3,771 | 977 | 5,459 |
| Cheverly | 694 | 211 | 111 | 28 | 1,045 | 73 | 107 | 648 | 188 | 1,016 |
| College Park |
1,775 | 937 | 1,051 | 272 | 4,035 | 613 | 674 | 1,813 | 809 | 3,909 |
| Forest Glen |
1,452 | 326 | 234 | 59 | 2,070 | 99 | 176 | 1,218 | 459 | 1,952 |
| Friendship Heights |
2,843 | 1,925 | 2,500 | 806 | 8,074 | 1,755 | 1,664 | 3,283 | 1,281 | 7,983 |
| Glenmont | 4,100 | 977 | 485 | 145 | 5,708 | 191 | 511 | 3,407 | 1,373 | 5,481 |
| Greenbelt | 3,578 | 1,146 | 682 | 203 | 5,610 | 366 | 609 | 3,283 | 1,240 | 5,498 |
| Grosvenor-Strathmore | 3,281 | 903 | 754 | 165 | 5,103 | 358 | 451 | 2,840 | 1,210 | 4,860 |
| Landover | 1,225 | 279 | 127 | 52 | 1,683 | 94 | 168 | 1,070 | 362 | 1,695 |
| Largo Town Center |
3,098 | 559 | 348 | 136 | 4,140 | 226 | 415 | 2,792 | 698 | 4,131 |
| Medical Center |
810 | 820 | 3,141 | 513 | 5,284 | 3,093 | 997 | 705 | 283 | 5,078 |
| Morgan Blvd. |
1,334 | 264 | 162 | 56 | 1,816 | 121 | 172 | 1,180 | 334 | 1,807 |
| Naylor Rd. |
1,443 | 462 | 286 | 146 | 2,337 | 166 | 312 | 1,288 | 467 | 2,233 |
| New Carrollton |
4,690 | 1,283 | 814 | 203 | 6,990 | 612 | 787 | 4,192 | 1,163 | 6,754 |
| Prince George’s Plaza |
2,152 | 963 | 826 | 355 | 4,295 | 360 | 725 | 2,166 | 938 | 4,190 |
| Rockville | 2,055 | 847 | 869 | 250 | 4,021 | 641 | 608 | 2,058 | 771 | 4,078 |
| Shady Grove |
8,196 | 2,049 | 1,190 | 262 | 11,697 | 637 | 1,102 | 7,065 | 2,559 | 11,362 |
| Silver Spring |
5,880 | 2,426 | 2,768 | 856 | 11,931 | 1,849 | 1,695 | 5,685 | 2,488 | 11,718 |
| Southern Ave. |
3,024 | 905 | 471 | 198 | 4,599 | 283 | 585 | 2,717 | 839 | 4,424 |
| Suitland | 2,653 | 780 | 883 | 194 | 4,510 | 732 | 544 | 2,308 | 804 | 4,388 |
| Twinbrook | 2,180 | 793 | 906 | 227 | 4,106 | 658 | 541 | 1,993 | 917 | 4,109 |
| West Hyattsville |
1,925 | 685 | 507 | 141 | 3,259 | 162 | 414 | 1,651 | 807 | 3,035 |
| Wheaton | 1,965 | 774 | 549 | 256 | 3,543 | 249 | 533 | 1,836 | 896 | 3,514 |
| White Flint |
1,613 | 689 | 1,066 | 244 | 3,612 | 850 | 532 | 1,512 | 660 | 3,554 |
| Md. April total |
71,141 | 24,235 | 24,717 | 6,929 | 127,022 | 17,310 | 16,788 | 65,634 | 24,605 | 124,336 |
| Va. Stations | AM ENTRY |
MID | PM | EVN | TOTAL ENTRY | AM EXIT |
MID | PM | EVN | TOTAL EXIT |
|---|---|---|---|---|---|---|---|---|---|---|
| Arlington Cemetery |
26 | 834 | 640 | 105 | 1,605 | 277 | 953 | 365 | 12 | 1,607 |
| Ballston | 4,519 | 1,809 | 3,046 | 667 | 10,040 | 2,422 | 1,440 | 4,400 | 1,699 | 9,960 |
| Braddock Rd. |
2,832 | 782 | 830 | 215 | 4,659 | 589 | 566 | 2,801 | 927 | 4,884 |
| Clarendon | 2,091 | 872 | 1,233 | 638 | 4,833 | 721 | 774 | 2,821 | 947 | 5,262 |
| Court House |
3,308 | 1,200 | 1,844 | 440 | 6,792 | 1,393 | 887 | 3,177 | 1,302 | 6,758 |
| Crystal City |
3,749 | 2,367 | 4,888 | 797 | 11,801 | 4,295 | 1,828 | 3,906 | 1,682 | 11,712 |
| Dunn Loring |
2,389 | 749 | 724 | 140 | 4,002 | 504 | 453 | 2,240 | 815 | 4,012 |
| East Falls Church |
2,602 | 697 | 613 | 140 | 4,052 | 247 | 408 | 2,528 | 819 | 4,001 |
| Eisenhower Ave. |
863 | 405 | 594 | 121 | 1,983 | 450 | 281 | 817 | 324 | 1,872 |
| Franconia-Springfield | 4,055 | 1,531 | 787 | 171 | 6,543 | 430 | 856 | 3,959 | 1,466 | 6,711 |
| Greensboro | 317 | 233 | 803 | 147 | 1,501 | 708 | 288 | 371 | 143 | 1,511 |
| Huntington | 4,912 | 1,131 | 629 | 187 | 6,858 | 319 | 724 | 4,311 | 1,375 | 6,730 |
| King Street |
2,538 | 1,562 | 2,091 | 735 | 6,926 | 1,551 | 1,350 | 3,043 | 1,115 | 7,060 |
| McLean | 753 | 338 | 1,069 | 118 | 2,278 | 932 | 299 | 716 | 271 | 2,218 |
| Reagan National Airport |
837 | 2,184 | 1,902 | 1,331 | 6,255 | 1,442 | 2,208 | 1,784 | 443 | 5,876 |
| Pentagon | 5,338 | 2,353 | 5,839 | 394 | 13,924 | 6,026 | 1,817 | 4,922 | 612 | 13,377 |
| Pentagon City |
5,532 | 2,985 | 3,247 | 1,365 | 13,130 | 1,469 | 2,601 | 6,889 | 2,216 | 13,174 |
| Rosslyn | 3,898 | 2,842 | 6,427 | 1,202 | 14,369 | 5,720 | 2,385 | 3,927 | 1,581 | 13,613 |
| Spring Hill |
429 | 236 | 445 | 116 | 1,226 | 344 | 222 | 459 | 190 | 1,216 |
| Tysons Corner |
617 | 631 | 1,750 | 635 | 3,632 | 1,351 | 903 | 1,154 | 378 | 3,785 |
| Van Dorn St. |
1,846 | 414 | 300 | 112 | 2,673 | 202 | 304 | 1,654 | 534 | 2,695 |
| Vienna | 6,306 | 1,750 | 1,051 | 264 | 9,371 | 500 | 1,005 | 5,747 | 2,003 | 9,254 |
| Virginia Square |
2,088 | 731 | 996 | 272 | 4,087 | 691 | 538 | 2,002 | 745 | 3,976 |
| West Falls Church |
1,882 | 516 | 233 | 58 | 2,689 | 96 | 269 | 1,751 | 558 | 2,674 |
| Wiehle-Reston East |
5,075 | 1,345 | 1,593 | 278 | 8,291 | 912 | 928 | 4,693 | 1,594 | 8,126 |
| Va. April totals |
68,803 | 30,498 | 43,575 | 10,648 | 153,524 | 33,591 | 24,287 | 70,436 | 23,750 | 152,064 |

