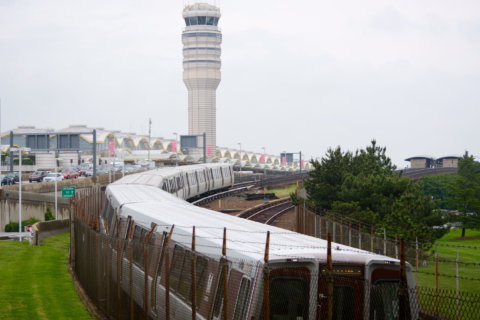
Many Metro trains are much less crowded, with ridership now around the lowest levels in nearly two decades.
Metrorail ridership fell to an average 595,000 weekday trips in the period from July through December, down 1.5 percent from the prior year, Metro’s quarterly reports show.
If the trend remains steady through May, when Metro typically benchmarks average weekday ridership, it would be the lowest usage since 2000, when a number of current stations in the system had not yet even opened. Ridership does typically increase a bit in the spring.
Even with the decline in rail and bus rider revenue to $351 million, Metro is ahead of budget due to significantly less spending than expected on operations personnel, power, materials and supplies, such as bus tires and computer software.
Metro’s current overall operational cost recovery rose from a budgeted 42 percent to 43 percent.
The decline in ridership, particularly outside of rush hour when Metro trains run less frequently or there is track work, has been cited as a reason to cut service or to resist a return to previous service levels.
Internal Metro reviews have found and publicly available data suggest that running more service would increase ridership.
Rider trends
More riders use the system in the middle of the week — Tuesday through Thursday — than on Mondays and Fridays when a significant number of people telework or take long weekends. Even midweek ridership now is far below just a few years ago.
Total rail ridership over the last six months of 2018 was 1.1 percent lower than what was intended to be a conservative forecast, dropping to 85.9 million trips.
Metrorail weekend ridership is down 3.5 percent from the previous year to an average 196,000 trips, mostly on Saturdays.
Regionwide Metrobus ridership is down 3.2 percent from the prior year overall to 366,000 trips on an average weekday. Weekend Metrobus ridership is down 4.2 percent to 158,000 trips on an average day.
Under federal guidelines, Metro is now switching to count Metrobus ridership based on automatic passenger counting systems on buses rather than farebox numbers due to faulty fareboxes and potential fare evasion issues. The automatic counts track more than 1 million additional trips each month.
MetroAccess ridership is up 1 percent to 8,000 average weekday trips, but that’s 2.5 percent below forecast.
With the government shutdown in January, average weekday rail ridership dropped 4 percent in Virginia to 244,545, Northern Virginia Transportation Commission documents show. Virginia Saturday rail ridership dropped 13 percent in January to 73,567. The Sunday average rose 2 percent to 50,930.
Virginia Metrobus ridership dropped another 8 percent on weekdays and 10 percent overall in January compared to the prior year.
Parking available
With the decline in ridership, has come a decline in parking usage.
Metro collected $22.2 million in parking fees from July through December, $1.6 million below budget.
While a handful of lots are more than 90 percent full on weekdays, many others have more spaces open than filled.
Wheaton, Landover and Deanwood are among the lots with the most empty spaces — as much as 74 percent empty at Wheaton.
Fort Totten, Van Dorn Street and East Falls Church are the most heavily used, followed by Grosvenor-Strathmore, Rockville, Naylor Rd. and Wiehle-Reston East.
Overall, Metro collected payments for usage from July through December that amount to 67 percent of all parking spaces in the system. The proportion of spaces used is 70 percent in Montgomery County, 65 percent in Prince George’s County, 68 percent in the District after declines during to track work, and 67 percent in Virginia.
Virginia parking usage data for January and December shows continued extra spaces at Dunn Loring, West Falls Church, Franconia-Springfield.
On time
By Metro’s measure, 87 percent of rail riders arrived on time in the last six months of 2018.
The numbers have remained relatively consistent since July 2017, with the exception of a decline during last summer’s Red Line shutdown and Blue, Orange and Silver Line single-tracking zones.
On weekdays, 88 percent of rail riders are counted as on time. On weekends, with regular major track work, 75 percent of riders are counted as on time. Metro counts a rider as on time if they exit their destination station within the time to walk from the fare gates to the platform plus the longest possible scheduled wait for a train at that time of day, plus the scheduled duration of the ride, plus the time Metro estimates it takes to walk from the platform to the fare gates to exit the station.
Green Line riders are most likely to be on time (94 percent), while Blue Line riders are least likely to be on time (84 percent).
Metro is still trying to improve MetroAccess scheduling, and plans a larger effort to keep water out of escalators and elevators after some recurring issues.
Metro’s customer satisfaction surveys put approvals at 77 percent for bus riders and 73 percent for rail riders.