WASHINGTON — Metro’s annual report card shows rail ridership is down from a peak of about 750,000 riders per weekday in 2009 to 593,000 per weekday in the last six months of 2016, contributing to Metro’s financial woes and fueling a proposal to cut scheduled service starting this summer.
The “Vital Signs Annual Report” that will be presented Thursday to the Metro Board’s Customer Service, Operations and Safety Committee notes a year-over-year ridership drop of 10 percent, with an 8 percent drop in ridership during rush hour and a 16 percent drop at other times.
Rider satisfaction appears to have leveled off to around 66 percent for rail riders and 77 percent for bus riders.
“Barring any seismic event, 2016 results may indicate a new normal for customer satisfaction,” according to the report.
This month, the Metro Board is expected to approve fare hikes and bus and rail service cuts that would start in July.
General Manager Paul Wiedefeld and regional leaders have warned that next year’s budget could include even greater cuts or put a greater strain on local budgets for schools, police and more.
Who’s on time, and who’s late?
While 85 percent of rail trips across the system last year were within five minutes of what Metro has determined as the expected trip time — getting from the fare gates to a platform, waiting for a train, riding to the destination station, then getting out of the fare gates — certain riders felt there were more significant delays.
Including the impact of weekend, midday, evening and round-the-clock track work, Orange Line riders were on time only 56 percent of the time in 2016 and only 33 percent of the time in December, when 24/7 track work was in place most of the month on the Orange and Silver Lines.
Silver Line riders were on time 35 percent of the time in December and 64 percent of the time over the course of 2016. The Red Line was on time 69 percent of the time in 2016, followed closely by the Blue Line with 70 percent of trips on time. The Yellow and Green Lines were nearly tied for the best performance at 74 percent and 75 percent on time respectively.
Rider drops, railcar breakdowns
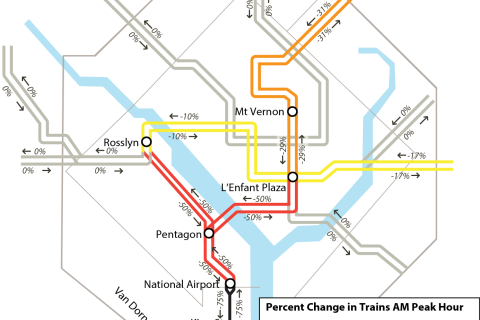
Metro staff believe 24/7 track work zones have cut about 10,000 to 20,000 rail trips each weekday morning. Bus trips that connect to rail are down 11 percent, compared to just a 3 percent decline for bus-only trips. Overall, bus ridership has dropped 5 percent to 413,000 trips on an average weekday.
The declines have an upside for riders sticking with the system for now, with less crowding noted in Metro’s most recent checks available. In August, September and October there were seven fewer rail stations where railcars were overcrowded. Blue and Silver Line trains at Rosslyn and Foggy Bottom, Green Line trains at L’Enfant Plaza and Red Line trains at Farragut North still had riders packed in at some points.
The report notes that there tends to be more crowding during the afternoon commute than the morning, with commuting condensed over about three hours and fewer trains usually available due to railcar breakdowns or other disruptions over the course of the day.
Riders did see about 13 percent fewer railcar-related delays last year compared to the year before, according to the report, but breakdowns still accounted for a majority of “unplanned” delays. The next most common causes of delays were police responses, sick riders and unattended bags at 14 percent and track problems at 7 percent. The report found that 5 percent of all delays in 2016 were due to safety-related speed restrictions.
Metro had about 78 percent of its railcars available on average in 2016, below the level of the last several years. But Metro ran fewer trains with round-the-clock work zones cutting scheduled service for months, which meant fewer cars needed to be working well for much of the year.
The system was also shut down twice in 2016, once for the blizzard in January and the other for emergency safety inspections in March.
Cars that break down most and least often
Metro’s middle-aged cars remained the most prone to breakdowns that cause delays in 2016. The 4000 Series, which is set to be retired by the end of the year, averaged 27,259 miles between delays. The 5000 Series cars averaged 47,056.
Metro’s newest trains, the 7000 Series, have improved to 82,611 miles between delays, but the slightly older 6000 Series cars remain the most reliable in the fleet with an average of 103,121 miles between delays.
The oldest cars that date to the beginning of the system, the 1000 Series, nearly matched the performance of the 7000 Series cars in December. Metro has retired more than half of the 1000 Series fleet, starting with some of the less reliable cars. As directed years ago by the National Transportation Safety Board, the 1000 Series cars are due to all be removed from the system later this year over concerns about how they can crunch in a crash.
Metro then plans to retire all of the 4000 Series cars by the end of the year, in an attempt to cut down on delays.
Metro expects more than 50 eight-car 7000 Series trains to be running by the end of 2017.
Bus breakdowns down, delays and crowding an issue on some routes
On the bus side, Metro said the average distance between breakdowns has increased, which means fewer issues for riders.
However, increased or unpredictable traffic contributed to a slight decline in the number of buses arriving on time, as they may arrive earlier or later than the posted schedule.
Delays on buses are most common in the afternoon, with the greatest impact on major roads across Maryland, Virginia and D.C.
The most crowded lines in the last three months of the year were: along 16th Street, Georgia Avenue-7th Street and Benning Road-H Street in the District; along Leesburg Pike, Columbia Pike, Lee Highway, Route 1 and the Ballston-Farragut Square and Dulles Airport line in Virginia; and the Greenbelt-Twinbrook, New Carrollton-Silver Spring, Eastover-Addison Road, Georgia Avenue, New Hampshire Avenue and Connecticut Avenue routes in Maryland.


