Each of the past six Super Bowl winners made different financial decisions in allocating their salary cap. Find out how.
COLLEGE PARK, Md. — Each of the past six Super Bowl winners made different financial decisions in allocating their salary cap.
Despite winning twice in three years, the New England Patriots paid their secondary more in 2014 and then used their money on linebackers in 2016. Meanwhile, the Seattle Seahawks and Baltimore Ravens took advantage of important players on cheap rookie deals, and the Denver Broncos emphasized the passing game on both ends of the ball.
Here’s how each of the past six Super Bowl champions managed their salary caps, measured by the percentage they spent on each position.
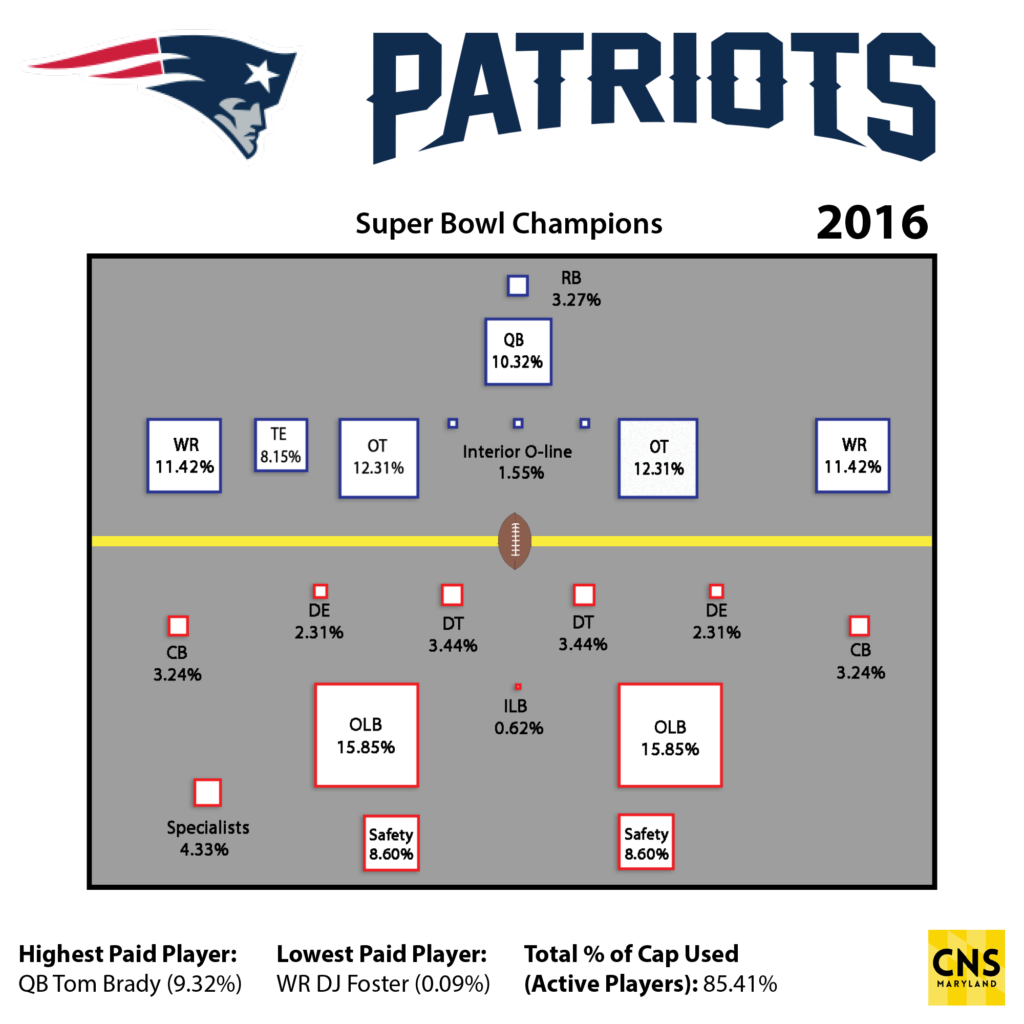
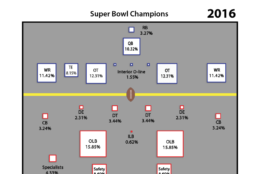
2016 New England Patriots
The Patriots’ clear objective in 2016 was building around quarterback Tom Brady, giving him both weapons and protection. In some cases, New England didn’t have to pay much to players on rookie contracts. But other players whose rookie deals expired needed raises.
Offensively, New England spent money on skill positions to help Brady. Tight ends Rob Gronkowski and Martellus Bennett each took up between 3.5 and 4.5 percent of cap space, and wide receivers Chris Hogan, Danny Amendola and Julian Edelman cost 8.66 percent in total. Additionally, Nate Solder and Marcus Cannon combined for over 11 percent of cap room, more than any other pair of starting offensive tackles among these Super Bowl winners.
Defensively, New England focused on outside linebackers over inside linebackers, employing seven of the former and two of the latter. Dont’a Hightower, who led all linebackers with 5.25 percent of the cap and was listed as an outside linebacker, was versatile enough to play both inside and outside when necessary. In the secondary, cornerbacks Malcolm Butler and Logan Ryan’s cheap first contract allowed New England to focus on paying safeties, mainly Devin McCourty. Finally, kicker Stephen Gostkowski in 2016 was the most expensive specialist among the 18 measured.
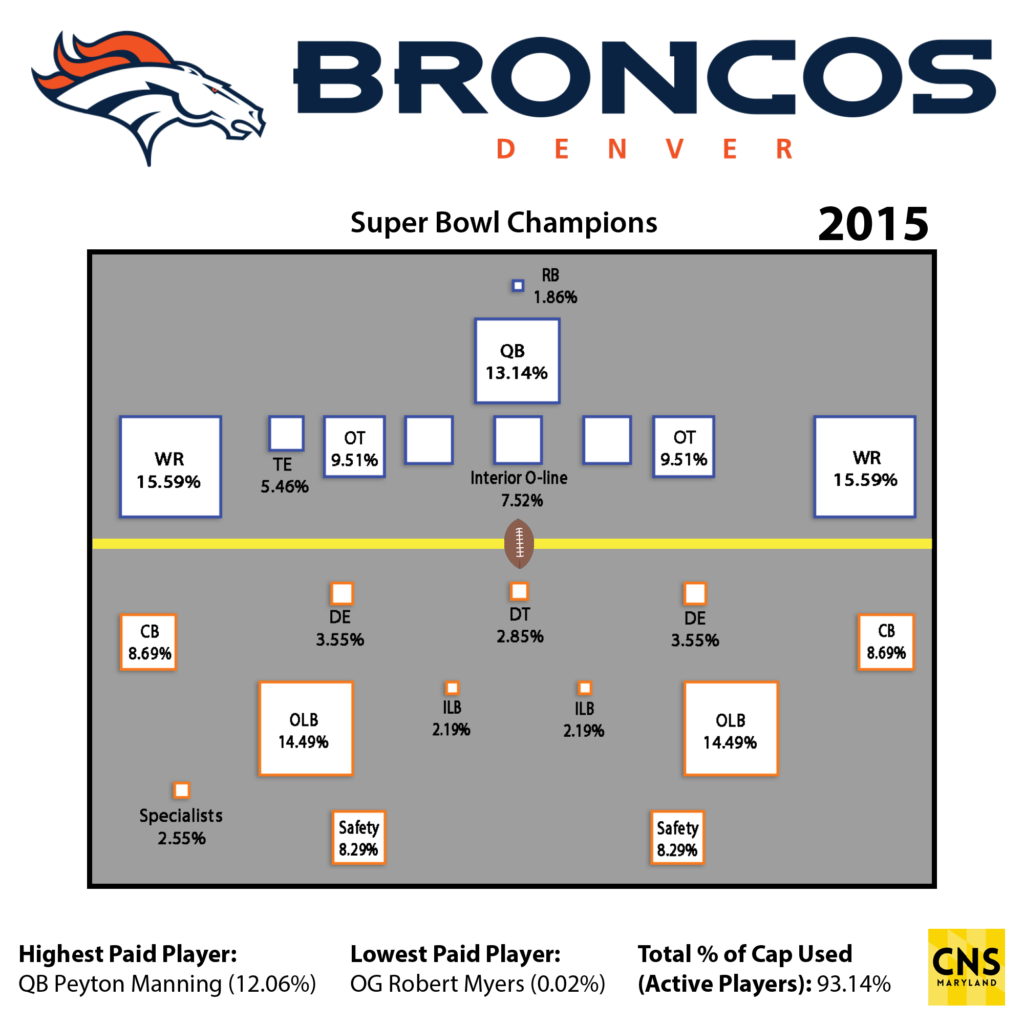
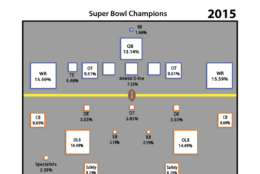
2015 Denver Broncos
Of the last six Super Bowl teams, the Broncos acquired more of their top contributors through free agency. Denver emphasized passing — both on offense and defense — instead of the running game.
While ineffective for the majority of the season, QB Peyton Manning still took up the most cap space. At 12.06 percent, he was the most expensive player on the last six Super Bowl winning teams. While OT Ryan Clady didn’t play a game due to injury, he still occupied 7.31 percent of cap space, meaning Denver only spent about 2 percent of its cap on tackles who actually played in 2015. The Broncos wide receivers combined to form the most expensive offensive position on this list, mainly due to Demaryius Thomas and Emmanuel Sanders’ combined 13.13 percent in cap space.
Defensively, the Broncos were able to pay talented players in its back seven, because CB Chris Harris’ $42 million contract extension did not kick in until 2016. Safety T.J. Ward, CB Aqib Talib and OLB Demarcus Ware joined the team in the 2014 offseason, combining for about 16 percent of the team’s cap. Due to the expensive back seven, Denver had to trust cheap talent on the defensive line, such as Malik Jackson and Derek Wolfe, which ultimately paid off.
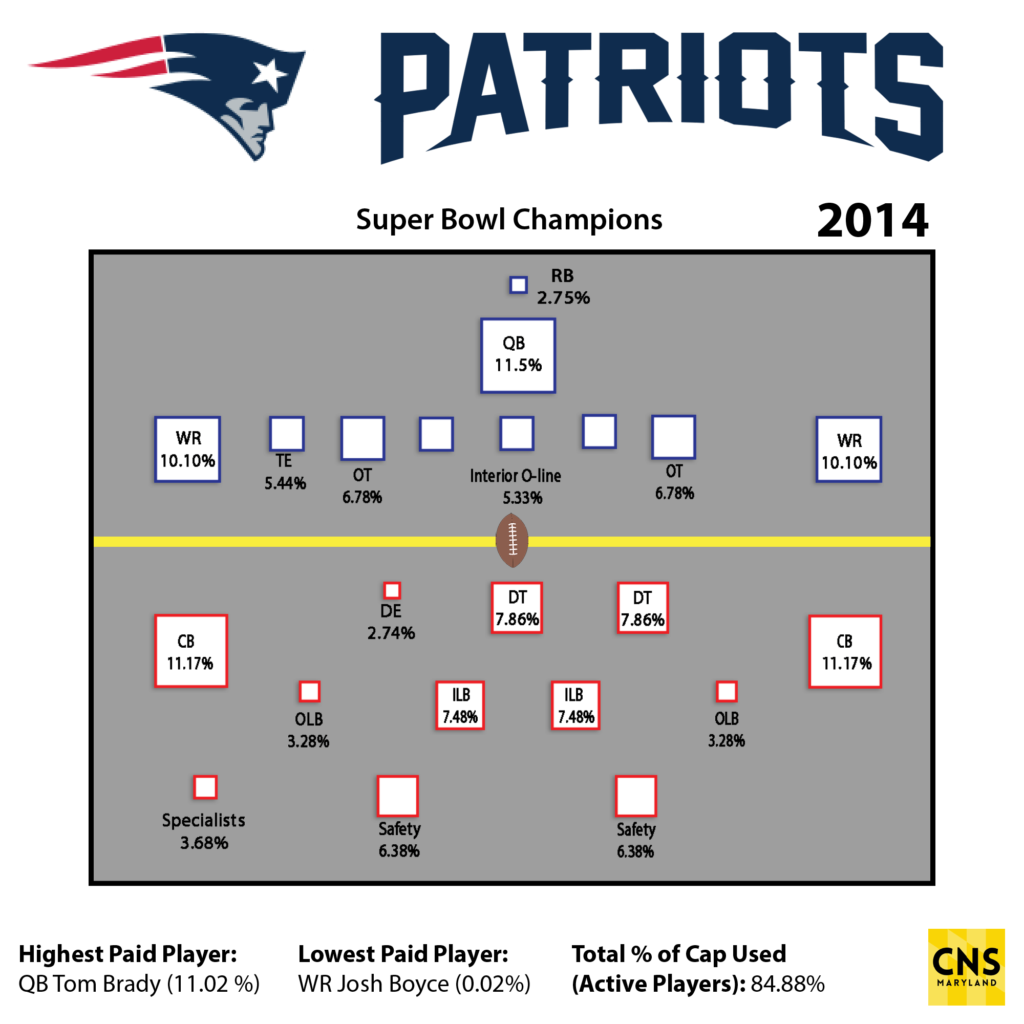
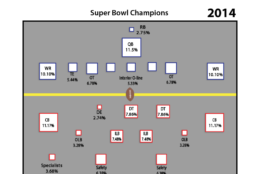
2014 New England Patriots
The biggest difference between the 2014 and 2016 Patriots was their secondary, because they spent more on players to help on the outside.
In 2014, New England paid expensive one-year contracts to cornerbacks Darrelle Revis and Brandon Browner in free agency, for 7.23 percent of the cap. New England had room to do that, because it was the year before McCourty hit free agency and signed a big extension and Butler was a rookie. DT Vince Wilfork’s presence was also key, as his 5.63 percent cap hit on the defensive line in his last year with the team. In 2014, Hightower was listed as an inside linebacker.
On offense, OG Dan Connolly’s 3.04 percent cap hit was a significant factor. The veteran retired after winning the Super Bowl and New England didn’t spend cap room trying to replace him, opting for cheap alternatives and draft picks when they won in 2016. OT Nate Solder was about 5 percent cheaper this year than in 2016, after signing a two-year, $20 million extension in 2015.
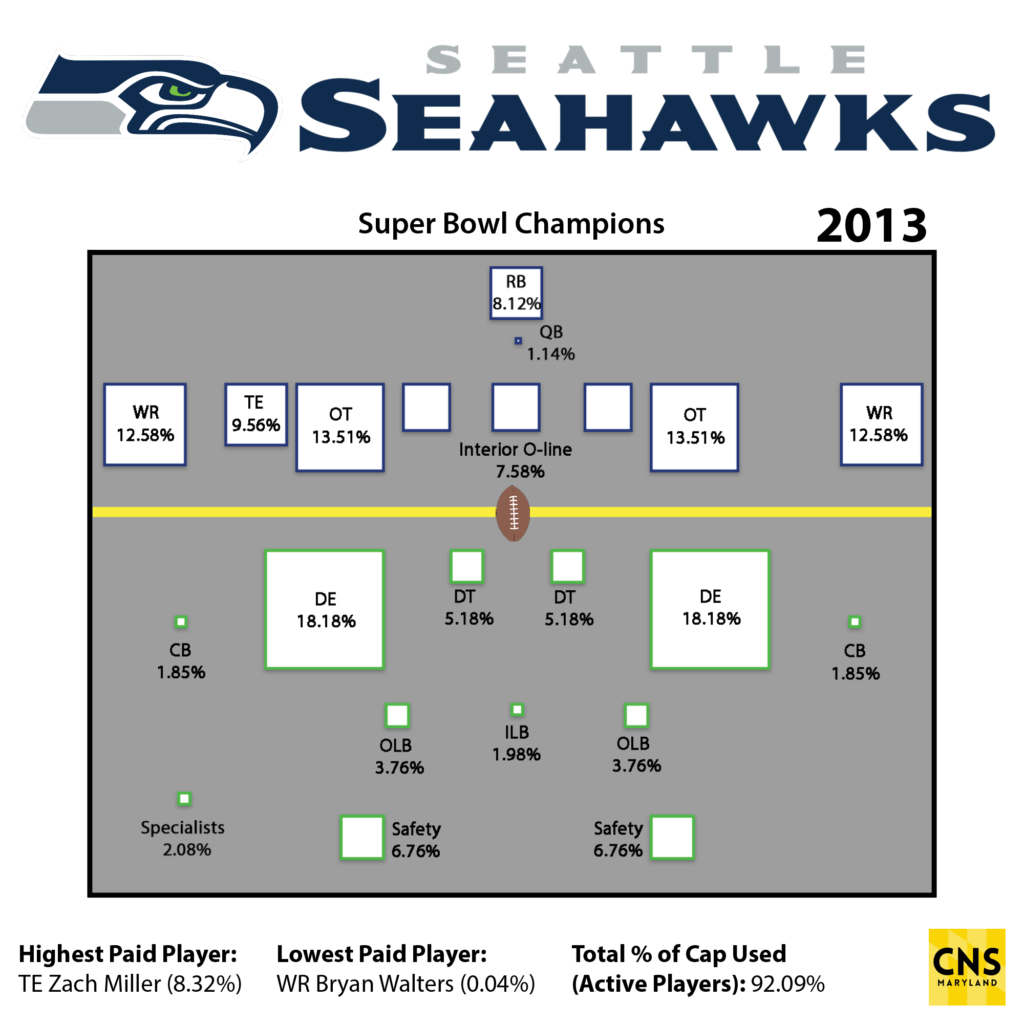
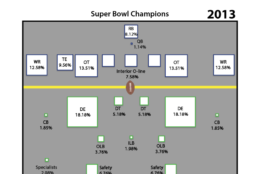
2013 Seattle Seahawks
More than any other recent Super Bowl winner, the Seahawks had the luxury of having their best players on cheap deals. They had a balanced offensive cap allocation, while defense was mainly spent on one position.
Seattle benefited from a cheap quarterback in 2013, with Russell Wilson on the second year of his third-round-pick rookie deal. The team used this money in part to pay RB Marshawn Lynch, its most important offensive player. At 6.36 percent of the cap, Lynch was the highest-paid running back on recent Super Bowl winners. The Seahawks were also the only team to have paid three offensive tackles at least 2.5 percent of cap space, led by Russell Okung’s 7.13 percent. Their highest paid player was TE Zach Miller, at 8.32 percent.
The Seahawks’ defensive ends were the most expensive of any position in this analysis. While they only had four, each player had a cap hit of at least 2.8 percent and two took up more than 5.5 percent of space. Seattle benefited from cheap rookie deals in the secondary, with stars such as CB Richard Sherman and safeties Kam Chancellor and Earl Thomas. Of Seattle’s four cornerbacks, none had a cap hit over 0.6 percent.
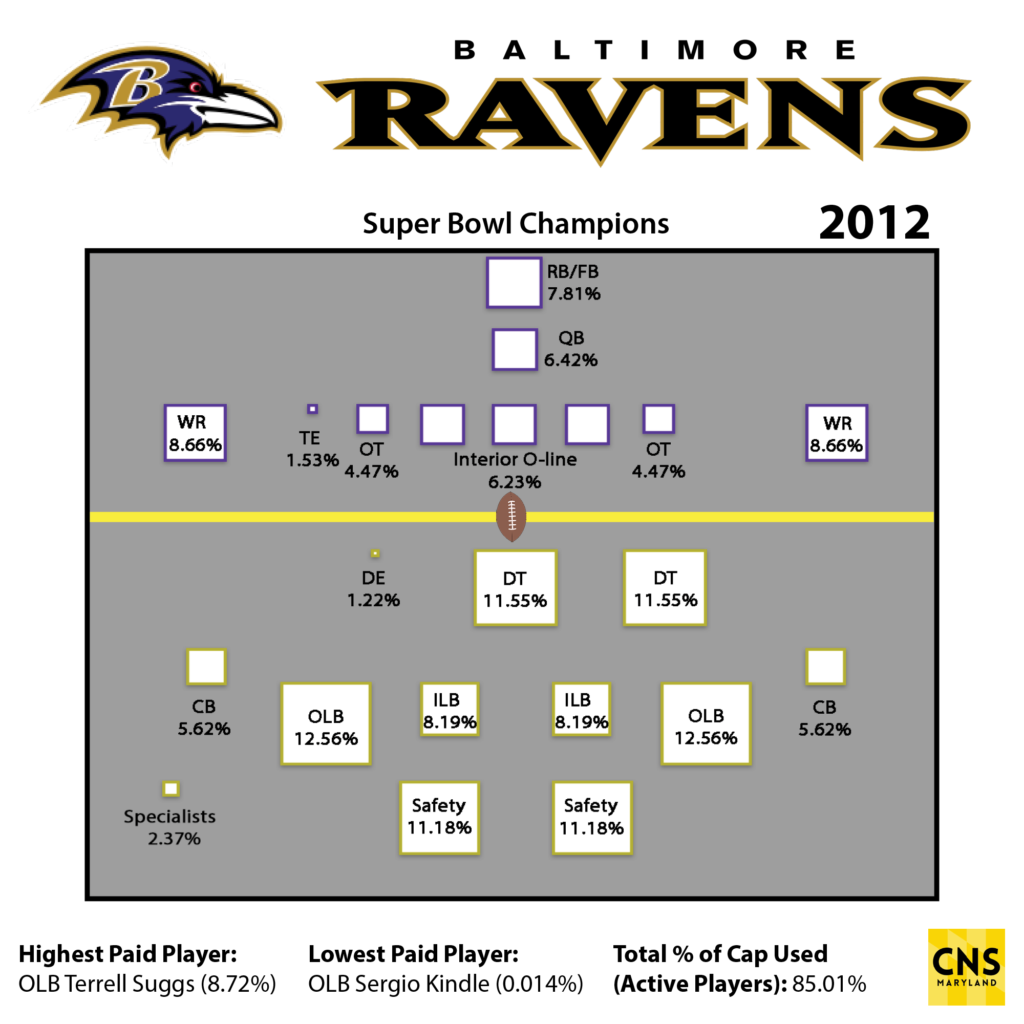
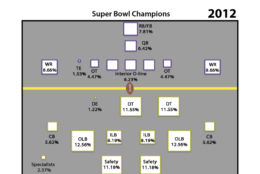
2012 Baltimore Ravens
Baltimore had a much more lopsided cap allocation than other recent Super Bowl champions. The Ravens spent much more on defense than on offensive players.
Since QB Joe Flacco didn’t sign his massive extension until after the season, he only cost 6.05 percent of the cap, giving Baltimore some flexibility. The Ravens’ only expensive players were RB Ray Rice, FB Vonta Leach and WR Anquan Boldin, combining for 12.76 percent. Leach was by far the most expensive fullback in this analysis. Baltimore also had the cheapest offensive line of the six teams, as OT Bryant McKinnie and OG Marshal Yanda were the only players with a cap hit over 2 percent.
On defense, the Ravens used most of their cap on important veteran pieces. OLB Terrell Suggs, S Ed Reed and DT Haloti Ngata were the team’s three most expensive players, with a combined cap hit of 23.83 percent. After Reed, Baltimore’s secondary was relatively cheap. The highest cap hit among the 12 remaining players was 1.98 percent.
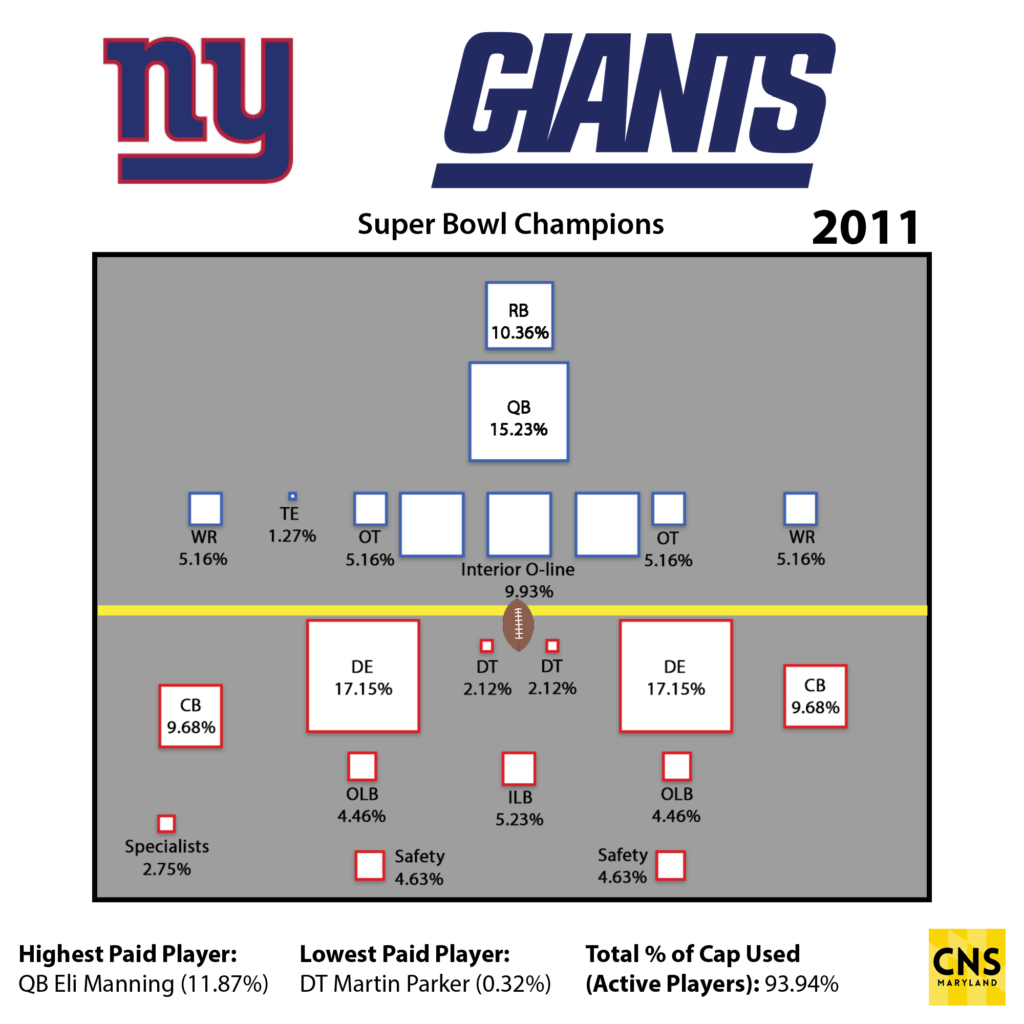
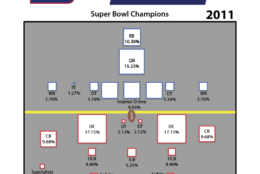
2011 New York Giants
The Giants were the only team to prioritize the running game more than the passing game offensively. And, similar to Seattle and New England in 2016, they took advantage of rookie contracts in the secondary.
While QB Eli Manning led the team in cap percentage, the Giants also employed the most expensive backup quarterback: Sage Rosenfels cost 2.92 percent of the cap. New York was also the only team to spend more on running backs than wide receivers, as Brandon Jacobs and Ahmad Bradshaw cost over 8 percent of the cap. Meanwhile, Mario Manningham and Hakeem Nicks only combined for a 1.31 percent cap hit, the only wide receivers above 1 percent on the team and by far the lowest percentage among a team’s highest paid receivers.
Defensively, the Giants’ Super Bowl team was known for its pass rushing defensive ends, and it showed in their cap. Defensive ends Chris Canty, Justin Tuck and Jason Pierre-Paul combined for 14.31 percent of the cap, and that doesn’t include Osi Umenyiora, who was listed as an outside linebacker. Finally, CB Corey Webster and S Antrel Rolle cost 8.29 of the secondary’s 14.31 percent cap hit.