If you’ve been watching baseball this season, you don’t need anyone to tell you: There have been a lot of dingers. And if you’re a Baltimore Orioles fan, well, you’ve seen the show from a rough perspective.
With that Yonder Alonso home run, the Orioles have now given up 72 home runs this year, a major league record for March/April. The old record coming into this season was….50.
— Chuck Garfien (@ChuckGarfien) April 30, 2019
The above tweet referenced the first of the two home runs the Orioles allowed Monday night, bringing their total for March/April to 73. Mercifully, they were rained out in Chicago Tuesday night, closing the book on this month.
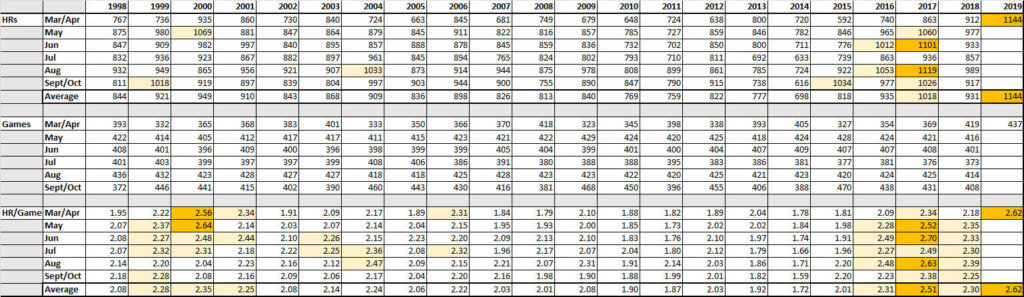
But the O’s are hardly alone. There were 1,144 home runs hit in MLB in March/April, shattering the record for the season’s opening month. On a per game average, that comes out to 2.62 per game, not just the highest for an opening month (and change), but one of the highest rates for a month in Major League history, surpassing even most of the then-record-breaking 2017 marks.
Baseball had not seen a 1,000-home run month in the 10 seasons prior to 2015. But starting at the end of that season and not really stopping since, the longball has exploded to rates unseen since the very height of the steroid era, and possibly even beyond.
Since May of 2000, MLB had not seen a month average more than 2.5 homers a game until May of 2017. In the 12 playing months since then, four have topped that mark, including the opening month of this season. Only three months since the start of 2016 have averaged fewer than 2.25 home runs per game, with two of those three being the opening months of the 2016 and 2018 seasons.
Click here for an expanded view of the chart below.
Year of the home run?
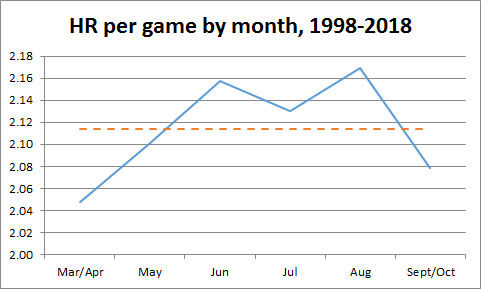
The gaudy early totals are not necessarily predictive of even greater numbers to come, but with the summer months on the horizon, that is generally what one would expect. You can look at things one of two ways. Since 1998, March/April games have averaged 2.05 home runs per game before this year, the lowest of any monthly average. The numbers trended upward from there in the summer months, topping out at 2.17 in August before coming back down in September.
The last five years have each seen a several percent jump in home runs per game in May from the previous month. But in 2000, the outlier year with the most galling March/April numbers (2.56/HR game), while the numbers jumped up even higher in May, they tailed off significantly after that, finishing with a season-long average of 2.35. That season-long mark was the highest until 2017, when it was 2.51. Of course, that home run spike may have had more to do with changes to certain athletes, rather than a standardized difference in equipment.
The longball is also occupying an outsized proportion of hits these days. Home runs first comprised more than 10 percent of the game’s hits in the mid-1950s, but it wasn’t until the early ‘90s that this was consistently true, year in and year out. In 2017, that figure reached a high of 14.5 percent. This year, it’s at 15.7 percent.
Force or object
University of Illinois Professor Emeritus of Physics Alan Nathan was one of the eight authors of the May, 2018 report commissioned by MLB to figure out what’s been happening over the last few years. If this is the kind of stuff you’re interested in, it’s worth reading in full, but the elevator pitch summary is thus: The difference can’t conclusively be tied to the forces being applied by the hitter, but rather by the aerodynamics of the ball.
While it’s true that players are hitting the ball more consistently in the air, harder, and at higher of an angle, the answer isn’t quite that simple. Since StatCast started tracking MLB in 2015, ground ball rates league-wide are down seven percent, while fly ball rate is up 20 percent (from 19.8 percent to 23.8 percent of total balls in play). Over the same time, league-wide exit velocity and launch angle have both steadily climbed. But the one year that broke the upward trend on both exit velocity and launch angle was…2017, the year the home run record was set. That led Nathan and his team (and us) to the ball.
“When you looked globally at all of Major League Baseball, you come to the conclusion that you really cannot account for the change in home runs by the change in launch conditions.”
Nathan’s team was also able to rule out certain atmospheric conditions as a variable, like temperature, but couldn’t account for something as complex as the wind. Nevertheless, they’re confident they found their culprit.
Specifically, the issue at hand is drag coefficient. In layman’s terms, the ball isn’t encountering as much resistance as it flies, so it is traveling farther through the air than before with the same forces applied to it by the batter. The tricky part is, they haven’t been able to identify what is different about the ball, even when it comes to popular theories.
“We have not been able to correlate any changes in the seam height or thickness of the seams with a change in the drag coefficient.”
Rob Arthur at Baseball Prospectus did some yeoman’s work to calculate some early-season drag coefficients earlier this season, and the results are glaring. Nathan has just started diving into the 2018 and 2019 numbers in the last two weeks, so perhaps down the line we’ll have a better understanding of the variance not just this year, but last year as well.
One of the more intriguing sets of numbers to come out of the first month of 2019 so far came via another Baseball Prospectus piece (this one’s behind the paywall), which showed that, after a dip last year, home run rates on fly balls and line drives to the middle of the field and the opposite field were up 30 and 47 percent, respectively, through April 22. So while home runs are up across the board, the percentage of them coming from the non-pull field is up from about 35.6 percent three years ago to nearly 40 percent in 2019.
That seems to follow logically knowing that more balls than ever are being hit in the air at higher and higher launch angles, taking advantage of the friendlier physics of this year’s baseballs. Though that doesn’t necessarily jibe with the science.
“Generally speaking, my expectation, based on what I know about the aerodynamics, is the ball should carry better to the pull field than the opposite field, just because of the way the ball is spinning,” said Nathan. “Getting more backspin on the ball doesn’t necessarily help give you more distance.”
Confirmation from below
To really see how much the new ball is impacting the game, you shouldn’t be looking up. You should be looking down.
This season, MLB decided to use the major league ball at Triple-A, rather than the seamier, minor league version. The results have been inescapable.
Through their first 24 games, the El Paso Chihuahuas were slashing .321/.397/.600 — as a team — with 61 home runs. Even in the always-homer-happy Pacific Coast League, that’s an insane 356 home run pace for just a 140-game season.
Only one PCL team has posted a team OPS higher than .860 dating back to 2005, when Reno posted an .873 mark in 2011. This year, four teams are at .869 or better (El Paso, Albuquerque, Las Vegas and Fresno), with the triple-digit temperatures of Southwest summers still to come.
Even the more pitcher-friendly International League — the other Triple-A league — has felt the effects. Indianapolis led the league with a .753 OPS in 2018. Ten of the 14 teams are ahead of that pace right now. In the last 10 years, Charlotte’s 176 home runs in 2014 were easily the most by any team. Six teams are ahead of that pace right now.
In conclusion
The exact “why” of the properties of the ball that are causing the lower drag coefficient (and, therefore, the longer ball flight) remain inconclusive thus far to Nathan and his team. But based on the early results and the general trends as the season unfolds, there’s no reason to think we won’t have a record-breaking, dinger-filled summer ahead.