Anyone who’s watched the Nats this year knows without checking the numbers that their bullpen has been brutal. But, well, we’re here to check the numbers anyway.
After narrowly escaping allowing any runs in their lone combined inning of work Sunday, the Nats lowered the team’s bullpen ERA to 7.41 (45 ER/53.2 IP). It was north of 8.00 until this weekend. Their WHIP is 1.76.
Last year, the worst relief corps belonged to the Marlins, who posted a 5.34 collective ERA. Meanwhile, Kansas City (1.55) was the only club with a WHIP north of 1.50. Only a few teams have posted team bullpen ERA’s higher than 5.50 for a season since the turn of the century, and the only one worse than 6.00 was the 2007 Tampa Bay Rays (6.16), who finished 66-96.
But the culprit of Washington’s results certainly hasn’t been overuse — no team has thrown fewer relief innings than the Nats, with the Pirates (59.1 IP) the only other team under 60 for the year. And yet, as relief usage rises across the league, results continued to get worse and worse for bullpens around MLB.
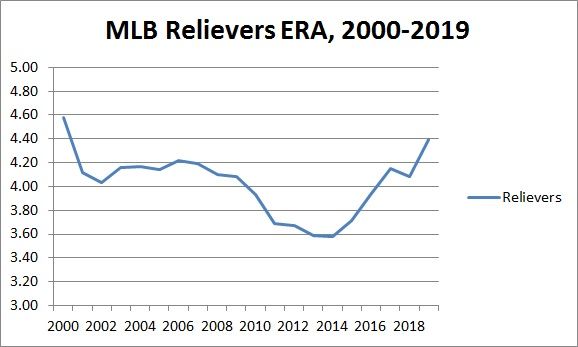
While ERA is an imperfect measure, in a large enough sample size — say, all of MLB for an entire season — it’s a pretty sturdy indicator. The bullpen ERA across the majors thus far this year is 4.39. That number might not jump off the page at you, but as teams get more and more specialized in their bullpens, there is a perception that relief pitching is more and more scrutinized. Yet, bullpen ERAs have been on the rise for five seasons now.
Reliever ERAs held fairly steady through most of the last decade in the low 4s, but 2010 (3.93) brought the first sub-4.00 ERA for bullpens across the big leagues since 1992. That number kept dropping every year through 2014, when it bottomed out at 3.58, more than a half a run below where it had been a decade prior. But since then, it has risen steadily, settling above 4.00 each of the last two years.

Usage has gone up during that time as well. Relievers cleared 17,000 combined innings for the first time last year, shattering the mark set the prior year and accounting for more than 40 percent of all innings pitched for the first time. This year so far, it’s up a tick again, to 40.7 percent. That rise in usage, which began in earnest in 2015, has coincided directly with the rise in reliever ERA.
As FiveThirtyEight pointed out last year, reliever usage rate rose from 38.1 percent in the regular season in 2017 to 46.5 percent in the postseason. But it seems like those postseason strategies have infected regular season managing, to detrimental results.
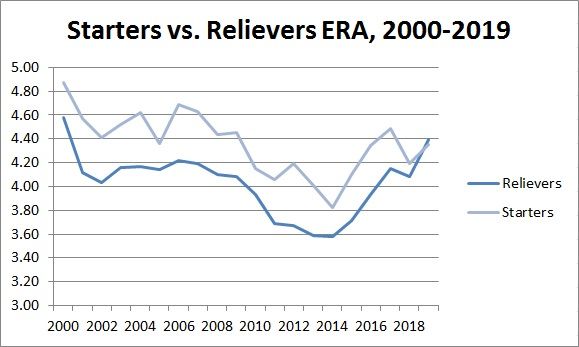
Throughout the history of baseball, bullpens have posted lower ERAs than starting staffs, often by more than half a run leaguewide. Last year, starters pitched to a 4.19 ERA, just .11 higher than relievers’ 4.08, the closest those numbers have been since 1973 (3.76/3.71). The last year that relievers had a cumulative ERA higher than starters was 1969 (3.60/3.65). But we’re on pace for that to happen once again this year.

Lest you think that Aprils tend to be particularly tough months on relievers, there is no discernible trend when it comes to April predicting the rest of the year. Since 2000, the average bullpen ERA in April has been 4.01. The average bullpen ERA overall, in every full year since then? Also 4.01. For what it’s worth, the average May ERA is 3.95, an almost imperceptibly small dip.
There are outlier months here and there, and we still have nine more days in April for these numbers to come down not just here in D.C., but across the league. But the trend of increased usage seems to be driving poorer results to the degree that we’ve reached an inflection point on the effectiveness of relievers. Nobody needs to tell the Nats to lean more on their starters. But perhaps it’s time the rest of the league take notice as well.


