WASHINGTON — Injury rates systemwide rose slightly for Metro workers and riders in 2016.
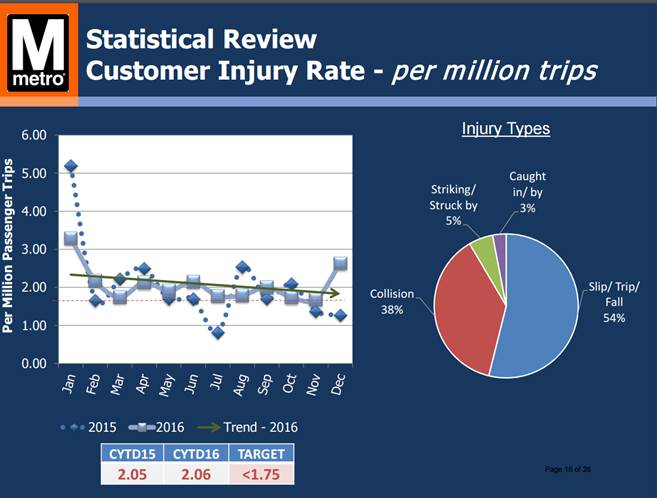
The system recorded 2.06 rider injuries per million trips, a 1 percent increase from 2015.
The actual number of reported injuries dropped (632 in 2016 versus 680 in 2015), but the drop was not as significant as the drop in riders across the system.
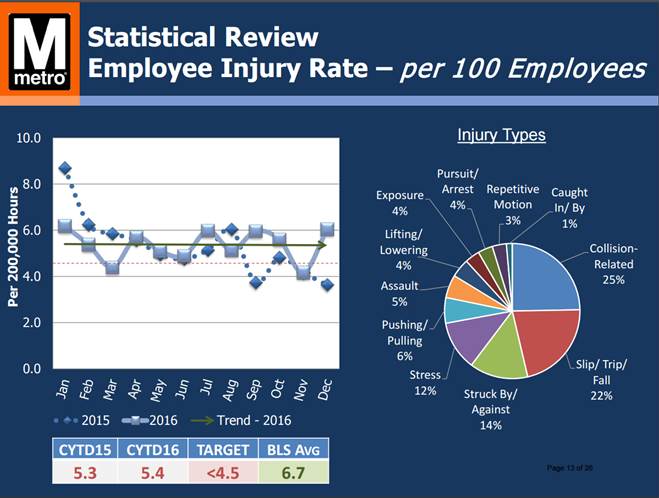
The employee injury rate also rose 1 percent: 5.4 injuries per 200,000 work hours, a time period equivalent to 100 employees working for a year.
Both rates were well above Metro’s internal targets.
Metro blames “non-preventable collisions”— such as crashes in which a bus is rear-ended — for a significant portion of these increased injury rates.
In the rail system, Metro noted an increase in slips, trips and falls on station escalators, especially when people were walking on escalators that were turned off.
Worker injury increases included stress-related injuries tied to being assaulted by riders, witnessing crime, or facing the extremely difficult situation of witnessing someone deliberately attempting to harm themselves.
All of these issues identified in Metro’s 2016 safety report are in addition to other ongoing issues, including:
- Trains running red signals
- Problems in the Rail Operations Control Center
- Worker-protection issues on the tracks, which were exposed again after federal inspectors were nearly run over by a train this fall
- Much-needed power system fixes
- Long-awaited changes to address tired workers on the job
- A series of other corrective action plans prompted by the Federal Transit Administration or National Transportation Safety Board, such as operational procedures for tunnel vent fans in emergencies
Rail rider injuries
The customer injury rate in the rail system was down 18 percent from 2015 to 1.43 injuries per million trips. The decline is largely due to the significant number of riders injured in the January 2015 Yellow Line smoke incident that killed Carol Glover.
Slips, trips and falls were the most common type of injury in the rail system in 2016. Slips and falls on escalators increased slightly from 2015 — from 111 to 113 incidents, even with fewer people using the system.
“These falls primarily occurred when the escalator was being used as a walker (i.e., not operating) and while the passengers were inattentive to their surroundings,” said documents prepared for the Metro Board’s Safety Committee.
Metro is looking into more announcements — similar to the ones heard on moving walkways in airports — near escalators where most injuries occur, advising riders to hold the handrail and pay attention as the escalator ends.
Metro also plans more station inspections to “reduce the number of facility issues that may result in customer injuries, such as loose floor tiles and poor housekeeping.”
Bus rider injuries
The injury rate for Metrobus riders rose 11 percent in 2016, compared with the year before.
The primary factor in the 311 injuries to riders across the system over the entire year was rear-end collisions. Other incidents included situations in which drivers had to slam on the brakes to avoid a crash.
Eighteen people walking or biking were struck by buses in 2016, four fewer than in 2015.
To reduce rear-end collisions, Metro is in the process of adding deceleration lights to the backs of its buses so other drivers are more aware when a bus is slowing down or stopping.
According to Metro, a pilot on 10 buses in 2016 demonstrated that the lights can reduce crashes.
To protect riders, buses are also adding strobe lights to increase the likelihood that passing drivers will notice people getting on and off the bus now that Virginia law has been changed to allow it.
MetroAccess rider injuries
The number of injuries for MetroAccess riders continues to rise sharply, up 55 percent from 2015 to 2016.
Metro blames most of the increase on a 79 percent increase in “non-preventable collisions,” from 19 crashes to 34. But it acknowledges that more paratransit riders were hurt last year while going to or from the van than the year before.
Riders are supposed to be safely assisted by the driver, who is an employee of the contractor that runs the paratransit service for Metro.
Metro hopes to have improved training for drivers within the next few months.
Employee injuries
The most common types of employee injuries in 2016 were collision-related (25 percent), slips/trips/falls (21 percent), struck by/against (14 percent) and stress-related (12 percent).
Nearly half of all employee injuries were in the bus transportation division.
Stress-related injuries rose 39 percent in 2016 from 2015, for a total increase of 245 percent over 2014.
“These injuries are the result of an employee being verbally assaulted, witnessing crime on the street, or being involved with a suicide event, with the latter being the historic cause for stress,” Metro Board documents said.
Metro believes that new shields that separate bus drivers from riders have helped reduce the number of physical assaults, but they have not had any impact on verbal assaults from riders.
On the rail side, Metro said the track and structures group saw more than twice the number of injuries in 2016 than it did in 2015, as Metro has increased track work time.
In the documents prepared for the Metro Board, however, chief safety officer Pat Lavin said that there was no significant increase in injuries tied directly to the expanded track work.