How do the Nats’ first 60 games compare to 2020? 2019? originally appeared on NBC Sports Washington
The Nationals eclipsed the 60-game mark last weekend, officially making their 2021 season longer than the pandemic-shortened campaign they played a year ago.
Washington went 26-34 over those first 60 games, which gave them an identical record to the one they finished with in 2020. A year prior, when the team was in the midst of overcoming a poor start to put together a World Series run, the Nationals were one game better at 27-33.
However, there’s much more to the story of each 60-game stretch than their records. Here’s a look at how each of the Nationals’ first 60 games from the last three years compares to one another.
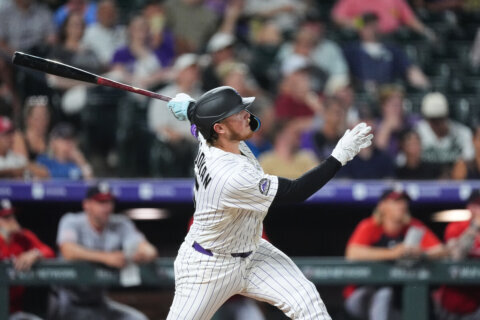
Offense
2019: 287 runs, 510 hits, 78 HRs, 204 walks, 545 strikeouts, 33 SBs, .749 OPS
2020: 293 runs, 519 hits, 66 HRs, 192 walks, 451 strikeouts, 33 SBs, .769 OPS
2021: 227 runs, 480 hits, 59 HRs, 178 walks, 518 strikeouts, 26 SBs, .697 OPS
If there’s one takeaway here, it’s that the 2021 Nationals experienced a significant drop in offensive production when compared to the previous two years. They did have fewer at-bats this season thanks to some seven-inning doubleheaders, but the stark difference in their offensive totals shows a clear drop-off this season.
The biggest difference was in the power department. Washington finished play Saturday, when they played their 60th and 61st games of the season in a doubleheader with the San Francisco Giants, tied for the eighth-lowest slugging percentage in baseball. Only three teams had fewer home runs. It may be unrealistic for the Nationals to suddenly start slugging homers, but history says their lineup is better than a .697 OPS.
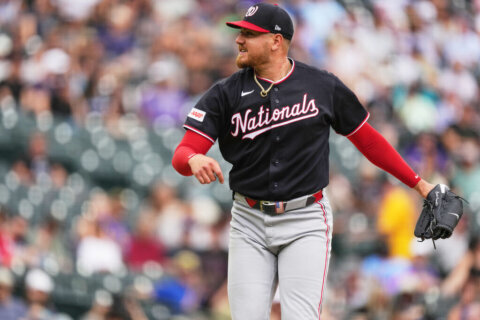
Rotation
2019: 348 IP, 18-20 record, 392 Ks, 117 walks, 40 HRs, 3.83 ERA, 1.24 WHIP
2020: 298 IP, 15-27 record, 283 Ks, 105 walks, 62 HRs, 5.38 ERA, 1.53 WHIP
2021: 305 IP, 15-24 record, 299 Ks, 114 walks, 51 HRs, 4.16 ERA, 1.24 WHIP
The Nationals’ rotation had its worst season in a decade last year, driven by Stephen Strasburg missing almost the whole season and Patrick Corbin turning in some career lows. Despite Strasburg continuing to miss time this year and Patrick Corbin battling inconsistency, the rest of the Nationals’ starters have helped avoid disaster.
Washington still isn’t pitching at the level it has in years past, but Max Scherzer (2.21 ERA) has been as good as ever while Erick Fedde and Joe Ross have been suitable fill-ins at the back end. The 2021 group’s numbers aren’t far off from those put up in 2019, leaving open the possibility that the Nationals’ rotation could return to form in time to make a run at the playoffs.
Bullpen
2019: 179.2 IP, 14 saves (11 blown), 189 Ks, 83 walks, 31 HRs, 6.66 ERA, 1.59 WHIP
2020: 205.2 IP, 12 saves (9 blown), 225 Ks, 111 walks, 32 HRs, 4.68 ERA, 1.50 WHIP
2021: 211.1 IP, 12 saves (5 blown), 229 Ks, 89 walks, 27 HRs, 4.00 ERA, 1.25 WHIP
The Nationals’ bullpen was bad in both 2019 and 2020, including the 102 games in between those two 60-game stretches. There have been clear signs of improvement in 2021, though injuries to Will Harris, Daniel Hudson and Austin Voth don’t help.
With Brad Hand settling into the closer role, the 2021 Nationals’ bullpen still can be a strength of their roster. It’s been the best-performing position group already, albeit not by much when compared to the rotation. But if the Nationals’ bullpen continues to pitch at this level while the rotation improves, their pitching staff will be in good shape.